

Biosignals Studio has multiple tools and features that allow you to process signals in different ways. These tools allow you to manually select individual filters, build your own filter chains or use signal processing modules that do all the heavy lifting for you with a single click.
In this article, we break down how the signal processing pipeline works and how the inputs and outputs of these individual tools impact your processing pipeline.
Processing Tools
In Biosignals Studio, you’ll find a variety of different processing tools. These tools all follow a signal processing pipeline and can be used either individually or in combination with each other.
Signal Processing Toolbar
The Signal Processing Toolbar in Biosignals Studio allows users to apply filters, processing pipelines, and analysis modules to biosignals data through a simple toolbar in the post-processing screen. All selected filters are applied on the entire signal.
Learn more about this feature here:
https://support.pluxbiosignals.com/knowledge-base/biosignals-studio-signal-processing-toolbar/
Signal Processing Toolbox
The Signal Processing Toolbox in Biosignals Studio lets you create and save custom processing profiles with one or more filters for different sensor types.
You can reuse these profiles across recordings to streamline signal preprocessing workflows and apply the profiles to selected signal segments.

Learn more about this feature here:
https://support.pluxbiosignals.com/knowledge-base/biosignals-studio-signal-processing-toolbox/
Signal Processing Modules
Signal Processing Modules provide one-click workflows for signal processing and feature extraction of biosignals such as HRV, EMG, respiration, and EDA, helping you analyze recordings more efficiently.
Processing Pipeline

Biosignals Studio processes signal data through a step-by-step signal processing pipeline shared across all processing tools.
The pipeline starts with the recorded sensor data, which can be either:
- Pre-processed sensor data generated directly by the sensor
- Raw sensor data (most common)

The output of each step becomes the input for the next step in the pipeline.
Example
Sensor signal → Processed by the Toolbar → Toolbar output becomes Toolbar Profiles input
You do not need to use all tools in the processing pipeline. For example, if you apply a Signal Processing Module directly without using Toolbar filters or Toolbox Profiles, the module uses the original sensor signals as its input.
This allows you to build your signal processing pipeline freely as needed.
Example: Using all processing tools
Sensor Signal → Toolbar → Toolbox Profiles→ Modules → End
Example: Using some processing tools
Sensor Signal → Toolbox Profiles → Modules → End
Example: Using only single tools
Sensor Signal → Module → End
Sensor Signal → Toolbar → End
Note that the Toolbar Profiles can be used to process only segments of sensor data, the output data of these profiles can be a mix of the input and output data.
Example:
30s sensor signal as input → Toolbox Profiles, process only the last 10 seconds
Resulting Toolbox Profile output signal:
00:00 to 00:20 – Original input sensor signal
00:20 to 00:30 – Toolbox Profile processed signal
The visualized filtered signals in Biosignals Studio always reflect the last signal of the Processing Pipeline.
View & edit your Processing Pipeline
You can access your processing pipeline at any time in the processing using the list icon in the toolbar.
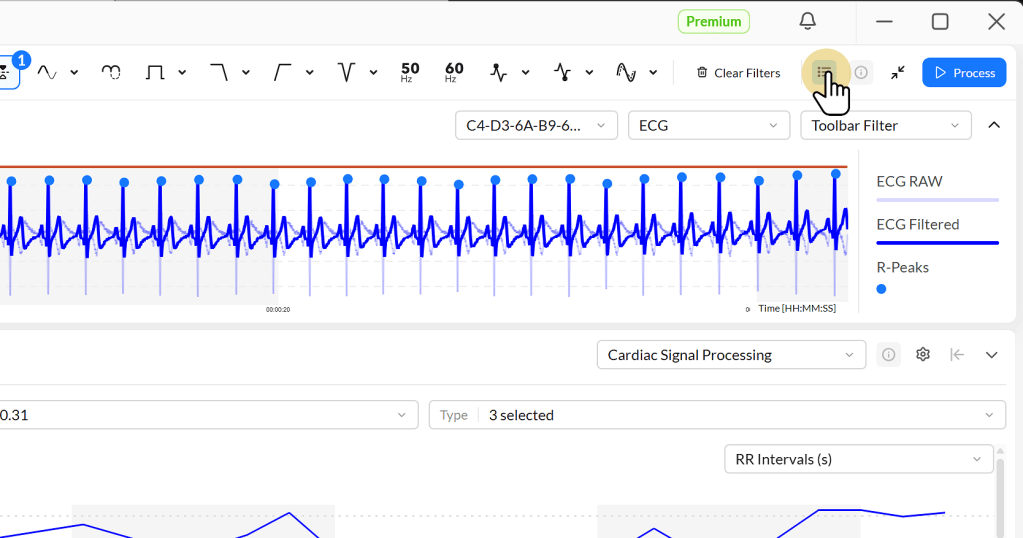
The Processing Pipeline sidebar lists all applied signal processing tools and their configurations.
In the following example, you’ll see the following information for each step of the pipeline:
- Toolbar: Invert filter
- Profiles (Toolbox): No profile processing action was executed
- Modules: Cardiac Signal Processing module

To delete filters, click on the trashcan icons of each listed filter or use the Clear All button at the bottom of the sidebar.
Tips for effective Signal Processing Pipelines
It’s possible to achieve the same or similar outputs with different tools and to apply different tools to the same signal segments. Keeping an eye on your Processing Pipeline helps you ensure that you’re using the right tools at the right time.
Here are a few additional tips to select the right tools and avoid mixups:
When to use the Signal Processing Toolbar
- Applying simple pre-processing actions (example: inverting the signal, removing frequency components, etc.)
- Apply one filter configuration across the entire signal
- Recording-specific signal processing (the processing toolbar settings are stored for your current recording file only)
💡 Example Use Case
Your recording shows 50 Hz noise throughout the entire signal. Apply a 50 Hz Notch or Powerline filter from the Toolbar, and it’ll clean your entire signal.
When to use the Signal Processing Toolbox Filters
- Creating more complex filters
- Create multiple filters with different characteristics (example: aggressive motion artifact filtering vs. light signal clean-up)
- Share filter configurations with your team (you can export and import profiles)
- Use filter profiles only on selected segments
Processing Profiles can be applied to selected signal segments or the entire signal (if you select the entire signal). Drag and drop the white edges to adjust your timeline or input the start and endpoints of the processing windows in the inputs on the left.

You can see the processed signal segment interval in the Processing Pipeline (example here: 00:00:00 – 00:00:31).

💡 Example Use Case
Your 10-min recording has a 10-second interval of motion artifacts. Create a profile to clean motion artifacts and apply it on a 10-second interval without impacting the rest of the signal.
When to use the Processing Modules
- 1-click processing solutions
- More advanced sensor-specific feature extraction & analytics (example: ECG → Heart Rate Variability (HRV) e
- Feature extraction & graphical representations of data
Processing Modules can be applied to selected signal segments or the entire signal (if you select the entire signal). Drag and drop the white edges to adjust your timeline, or input the start and endpoints of the processing windows in the inputs on the left.

You can see the processed signal segment interval in the Processing Pipeline (example here: 00:00:00 – 00:00:31).
![Cardiac signal processing interface displaying 'Port 1 - Bundle 1 [ECG]', time duration indicators, and processing module settings options.](https://support.pluxbiosignals.com/wp-content/uploads/2026/05/CleanShot-2026-05-20-at-11.08.13@2x-300x93.png)
💡 Example Use Case
You’ve run your entire Heart Rate Variability (HRV) experiment in a single recording, including the 5-min pre-experiment and post-experiment baseline recordings.
Apply the HRV processing intervals at different segments to extract the results of the different conditions of your experiment, without having to handle multiple recording files:
00:10 to 05:10 → Pre-experiment baseline HRV analysis
06:00 to 10:00 → Experiment HRV analysis
10:30 to 15:30 → Post-experiment recovery HRV analysis
Avoid duplicate filters
- You can build simple filter chains both with the Toolbar and the Toolbox Profiles; avoid using the same filters in both steps
Example:
Inverted Signal → Toolbar: Invert Filter (corrects it) → Toolbox Profile: Invert Filter (inverts it again as in the original input signal)
- Check the timestamps of when Toolbox Profiles and Modules are applied to ensure you’re filtering at the right, expected moments
- Processing Modules already carry sensor-specific signal pre-processing features, making the use of Toolbar or Toolbox redundant in many setups
FAQs
My signal changes abruptly before and after a processed segment.
Processing outputs of Toolbox Profiles that only process a segment of the signal are a product of the original input signal and the processed segment.
In this case, the processed segment from the original input signal replaces the original segment.
The following example demonstrates a 30 second signal, with a Transform filter applied in the interval of 10s and 20s that multiplied the sensor signal by 2.

The resulting output signal consists of:
– 00:00 to 00:10 – Original input signal
– 00:10 to 00:20 – Processed signal
– 00:20 to 00:30 – Original input signal
Can I edit the order of the processing pipeline?
No, the order is fixed to Toolbar → Toolbox Profiles → Modules.
