Biosignals Studio (Desktop) offers a Signal Processing Toolbox in post-processing mode that allows you to build, save, and share different signal processing profiles.
Here you’ll find access to all available filters, how to create your own processing profiles, and how to share these with your colleagues.
In this article, you’ll learn how to get the most out of the feature.
Paid Feature
This feature is available on all Biosignals Studio (Desktop) Academic & Commercial licenses.
How to access the Toolbox
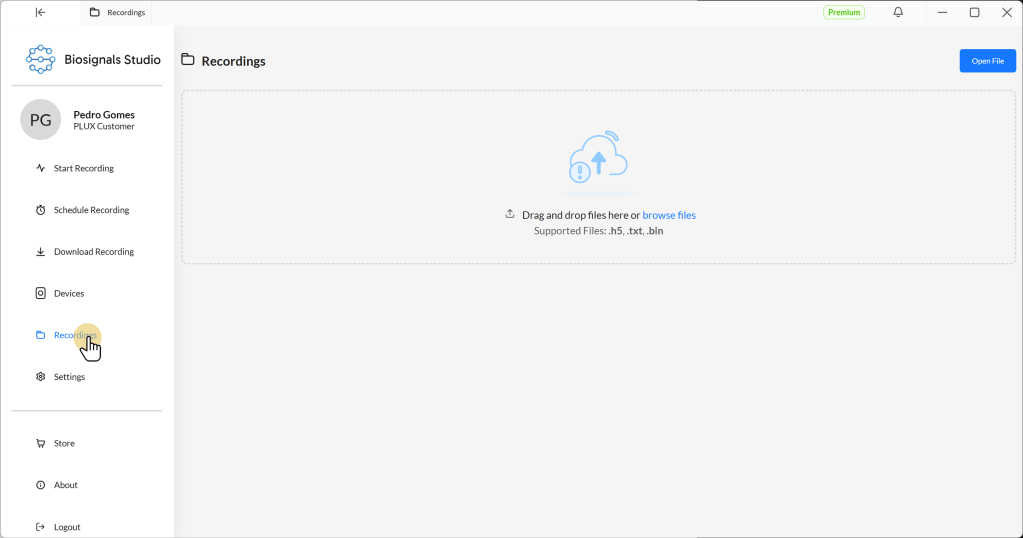
Go to your Recording and open your recording file using one of the following methods.
- Using the file browser through the Open File dialog
- Drag’n’drop the file into the recordings window
- Select a recording from the Recent Recordings list (if available)
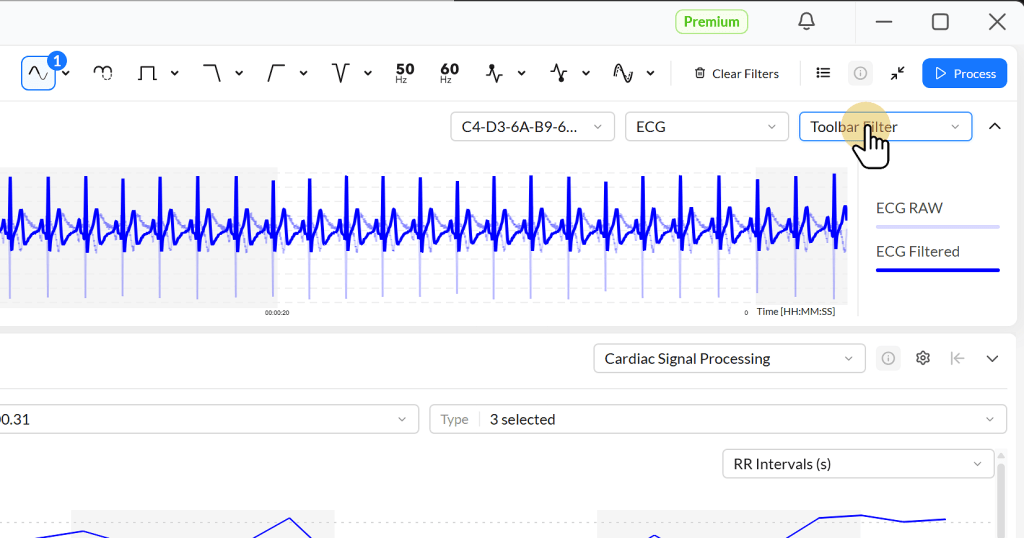
Select the signal you want to process and click Process

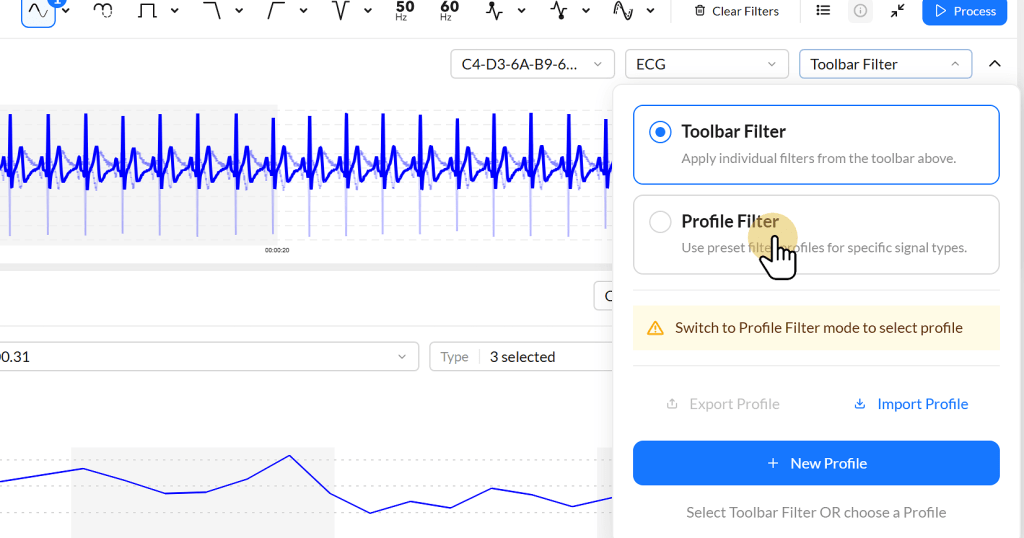
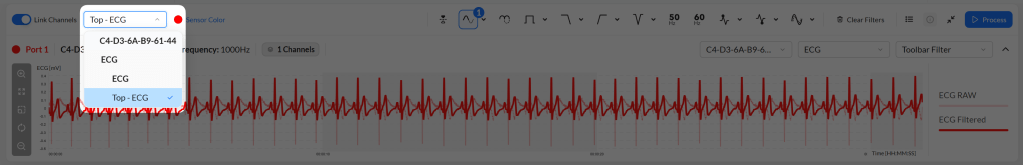
Select the Toolbar Filter dropdown in the top-right corner of the processing screen.
Switch from the Toolbar Filter to Profile Filter.
Processing Context
The Signal Processing Toolbox is the second stage of the Biosignals Studio Signal Processing Pipeline, after the Signal Processing Toolbar and operates in the following context:
- The input data can be:
- Sensor signals already processed with Toolbar filters, if the Toolbar was used.
- Raw or sensor pre-processed signals, if the Toolbar was not used.
- Toolbox filters are applied only to the selected signals
- Filters can be applied to specific signal segments or to the entire signal (if the full signal is selected)
- Toolbox filter profiles are signal-type specific. For example, an ECG processing profile can only be applied to ECG signals
- The processed output signals generated by the Toolbox can then be used as input for other Processing Modules later in the pipeline
Signal Profiles
Filter Profiles are reusable collections of Toolbox filter settings that can be saved and applied to signals of the same type.

They let you quickly repeat a signal-processing workflow without manually reconfiguring each filter.
Example
An ECG filter profile may include a combination of smoothing, filtering, and peak detection settings optimized for ECG analysis.
You can create different profiles for different processing goals.
Example
ECG Profile A → Apply more aggressive filtering to reduce motion artifacts
ECG Profile B → Perform only light signal cleanup to preserve more signal detail
These profiles can then be applied to different segments of the same recording, depending on the signal quality or analysis requirements. Or applied for the entire recording. You can control the segment you want to process using the overview window at the bottom of the screen.

Unlike the Signal Processing Toolbar, Filter Profiles are available for all recordings once saved and can be reused out of the box.
However, profiles are signal-type specific and can only be applied to compatible signals. For example, EMG profiles will not appear as available options for ECG signals.
Available Filters
Basic Filters
Basic Signal Filters directly transform the signal’s amplitude or structure. These filters are commonly used as the first processing step to prepare signals for further analysis, such as rectification, normalization, interpolation, or baseline correction.
| Filter | Description & Inputs |
|---|---|
| Cubic Interpolation | Upsamples the signal using cubic spline interpolation to generate smoother transitions between samples. [Input Parameters] Target Frequency Defines the new sampling frequency for the interpolated signal. Higher frequencies produce denser signals with more interpolated samples. |
| Transform | Multiplies the signal by a constant factor to amplify or attenuate signal amplitude. [Input Parameters] Transform Constant (K) Values greater than 1 amplify the signal; values between 0 and 1 attenuate it. |
| Invert | Flips the signal vertically by multiplying all values by -1. |
| Full Wave Rectification | Converts all negative signal values into positive values using the absolute value of the signal. |
| Half Wave Rectification | Sets all negative values to zero while preserving positive values. |
| Normalize | Scales the signal relative to its maximum amplitude. |
| Binary | Converts the signal into binary states based on a threshold. [Input Parameters] Threshold Values above the threshold are converted to 1; values below are converted to 0. Higher thresholds detect only stronger activations. |
| Detrend | Removes slow-changing trends or baseline drift from the signal. [Input Parameters] Detrend Type Select linear or constant detrending depending on the type of baseline drift to remove. |
Smoothing Filters
Smoothing Filters reduce short-term fluctuations and noise to create cleaner and more stable signals. They are commonly used to generate signal envelopes, reduce motion artifacts, and prepare signals for further analysis.
| Filter | Description & Inputs |
|---|---|
| Moving Average (MA) | Reduces short-term fluctuations by averaging neighboring samples over a moving window. [Input Parameters] Window Size (ms) Larger windows create smoother signals but may remove fast variations; smaller windows preserve more detail. |
| Moving RMS | Calculates the moving root-mean-square value to smooth and emphasize signal energy, commonly used in EMG processing. [Input Parameters] Window Size (ms) Larger windows produce smoother envelopes; smaller windows retain faster changes and transient activity. |
Peak & Valley Detection
Peak & Valley Detection filters identify local maxima and minima within the signal waveform. These filters are commonly used for event detection, onset analysis, repetition counting, heartbeat detection, and feature extraction workflows.
| Filter | Description & Inputs |
|---|---|
| Peak Detection | Detects local signal peaks for onset or event identification. [Input Parameters] Minimum Peak Amplitude Higher thresholds ignore smaller peaks; lower thresholds detect more peaks, including noise. Minimum Interval Between Peaks Larger intervals reduce repeated detections of the same event; smaller intervals allow closely spaced peaks. |
| Valley Detection | Detects local signal valleys for event identification and waveform analysis. [Input Parameters] Minimum Valley Amplitude Higher thresholds ignore smaller valleys; lower thresholds detect more valleys, including noise. Minimum Interval Between Valleys Larger intervals reduce repeated detections of the same event; smaller intervals allow closely spaced valleys. |
Finite Impulse Response (FIR) Frequency Filters
FIR (Finite Impulse Response) Filters modify the frequency content of the signal using stable linear-phase filtering methods. They are commonly used to remove unwanted frequency components such as baseline drift, high-frequency noise, or powerline interference while preserving waveform shape.
💡 Tip for when to use FIR Filters
_________________________________
Use FIR filters when preserving the original waveform shape is important.
FIR filters introduce minimal phase distortion, making them well-suited for biosignals where waveform morphology matters, such as ECG, EEG, or respiration analysis. Great for smaller datasets.
| Filter | Description & Inputs |
|---|---|
| FIR Low-Pass Filter | Removes high-frequency components while preserving slower signal variations. [Input Parameters] Window Type: Select the FIR window function used for filter generation (blackman, hamming, hann) Cutoff Frequency: Frequency after which higher frequencies are suppressed. Filter Order: Higher orders create steeper filtering transitions. |
| FIR High-Pass Filter | Removes low-frequency drift while preserving faster signal changes. [Input Parameters] Window Type: Select the FIR window function used for filter generation (blackman, hamming, hann) Cutoff Frequency: The frequency at which lower frequencies are suppressed. Filter Order: Higher orders create steeper filtering transitions. |
| FIR Notch Filter | Removes a narrow frequency band, commonly used for powerline noise suppression. [Input Parameters] Cut-Off Frequency: Defines the frequency to suppress. Quality Factor (Q): Higher Q removes a narrower frequency band; lower Q removes a wider band around the target frequency. |
| FIR Band-Pass Filter | Preserves only frequencies within a selected frequency range. [Input Parameters] Window Type: Select the FIR window function used for filter generation (blackman, hamming, hann) Low Cutoff Frequency: Define the lower preserved frequency limits. All frequencies < this cutoff are suppressed. High Cutoff Frequency: Define the higher preserved frequency limits. All frequencies > this cutoff are suppressed. Filter Order: Higher orders create steeper filter transitions. |
| FIR Band-Stop Filter | Removes frequencies within a selected frequency range while preserving frequencies outside that range. [Input Parameters] Window Type: Select the FIR window function used for filter generation (blackman, hamming, hann). Low Cutoff Frequency: Defines the lower boundary of the rejected frequency range. Frequencies above this value are suppressed. High Cutoff Frequency: Defines the upper boundary of the rejected frequency range. Frequencies below this value are suppressed. Filter Order: Higher orders create steeper filter transitions and sharper rejection of the selected frequency band. |
Infinite Impulse Response (IIR) Frequency Filters
IIR (Infinite Impulse Response) Filters use Butterworth filter designs, which are widely used in biosignal processing due to their smooth frequency response and efficient filtering performance.
Butterworth filters are especially popular for ECG, EMG, EEG, and respiration processing because they provide strong noise reduction without introducing abrupt changes in the signal response.
Compared to FIR filters, IIR Butterworth filters achieve sharper filtering with lower filter orders, making them computationally efficient even for large recordings. They are commonly used for low-pass, high-pass, band-pass, and notch filtering operations in biosignal analysis workflows.
💡 Tip for when to use IIR Filters
________________________________
Use IIR filters when stronger filtering and faster processing are more important than perfect waveform preservation.
IIR filters achieve sharp filtering with lower filter orders and are useful for quickly removing noise or drift from large datasets.
| Filter | Description & Inputs |
|---|---|
| IIR Low-Pass (Butterworth) | Removes high-frequency components while preserving slower signal variations. [Input Parameters] Cutoff Frequency: Frequency after which higher frequencies are suppressed. Filter Order: Higher orders create steeper filtering transitions. |
| IIR High-Pass (Butterworth) | Removes low-frequency drift while preserving faster signal changes. [Input Parameters] Cutoff Frequency: The frequency at which lower frequencies are suppressed. Filter Order: Higher orders create steeper filtering transitions. |
| IIR Band-Pass (Butterworth) | Preserves only frequencies within a selected frequency range. [Input Parameters] Low Cutoff Frequency: Define the lower preserved frequency limits. All frequencies < this cutoff are suppressed. High Cutoff Frequency: Define the higher preserved frequency limits. All frequencies > this cutoff are suppressed. Filter Order: Higher orders create steeper filter transitions. |
| IIR Notch (Butterworth) | Removes frequencies within a selected frequency range while preserving frequencies outside that range. [Input Parameters] Low Cutoff Frequency: Defines the lower boundary of the rejected frequency range. Frequencies above this value are suppressed. High Cutoff Frequency: Defines the upper boundary of the rejected frequency range. Frequencies below this value are suppressed. Filter Order: Higher orders create steeper filter transitions and sharper rejection of the selected frequency band. |
Filter Bundles & Workflow Bundles
Bundle Filters are predefined combinations of multiple filters commonly used for specific biosignal processing tasks.
They simplify complex workflows by grouping several processing steps into a single configurable operation, which is why default bundles such as the Binary Onset Bundle for EMG activation and onset detection are included in the Toolbox.
Need more of these?
Share your feedback by rating this article and leaving a comment. The more requests we get, the more preset bundles we’ll add in future updates.
| Filter Bundle | Description & Inputs |
|---|---|
| Binary Onset Bundle | Combines thresholding and activation detection into a simplified onset detection workflow, commonly used for EMG activation analysis. [Input Parameters] Threshold: Defines the activation threshold. Higher thresholds detect only stronger activations; lower thresholds are more sensitive but may detect more noise. Tolerance Window: Smooths activation continuity over time and reduces fragmented activations. Larger windows merge nearby activations more aggressively. New Value: Defines the value assigned to detected activation regions. |
Creating your own profiles
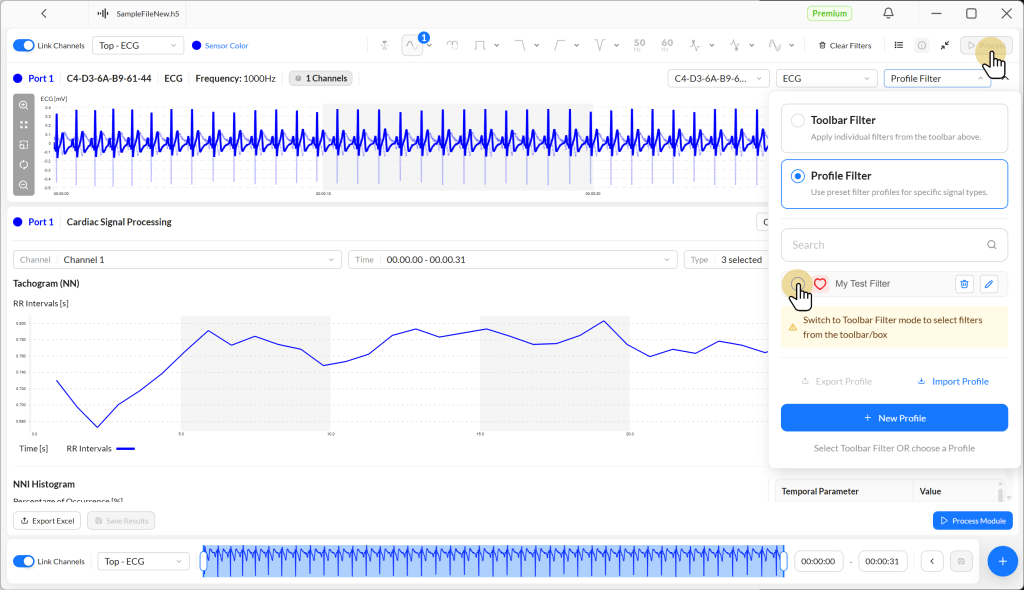
Go to the processing tool dropdown and select Profile Filter. Click the + New Profile button.

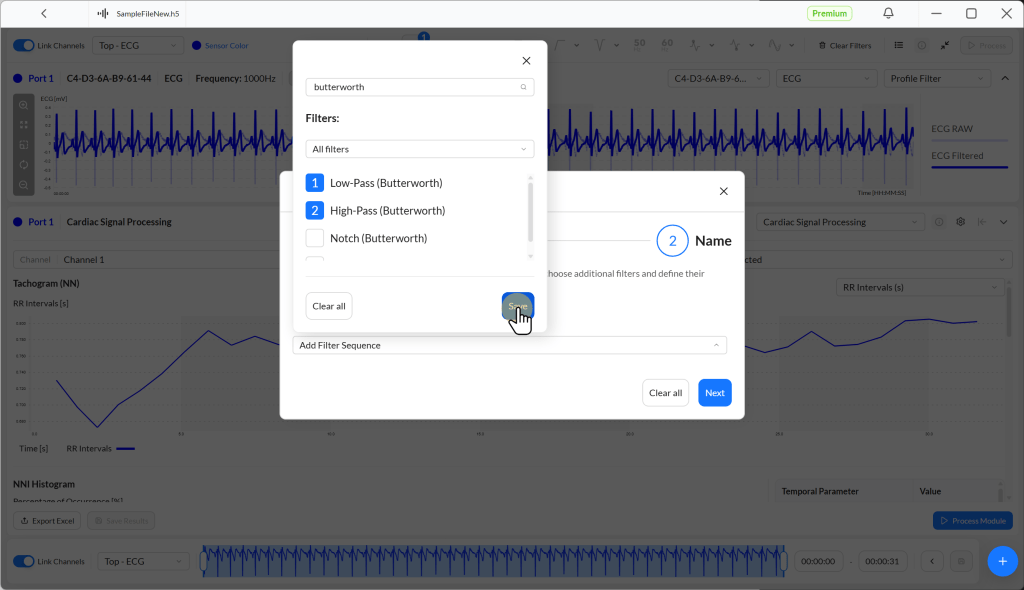
In the new window, use the Add Filter Sequence dropdown to browse available filters and select them.
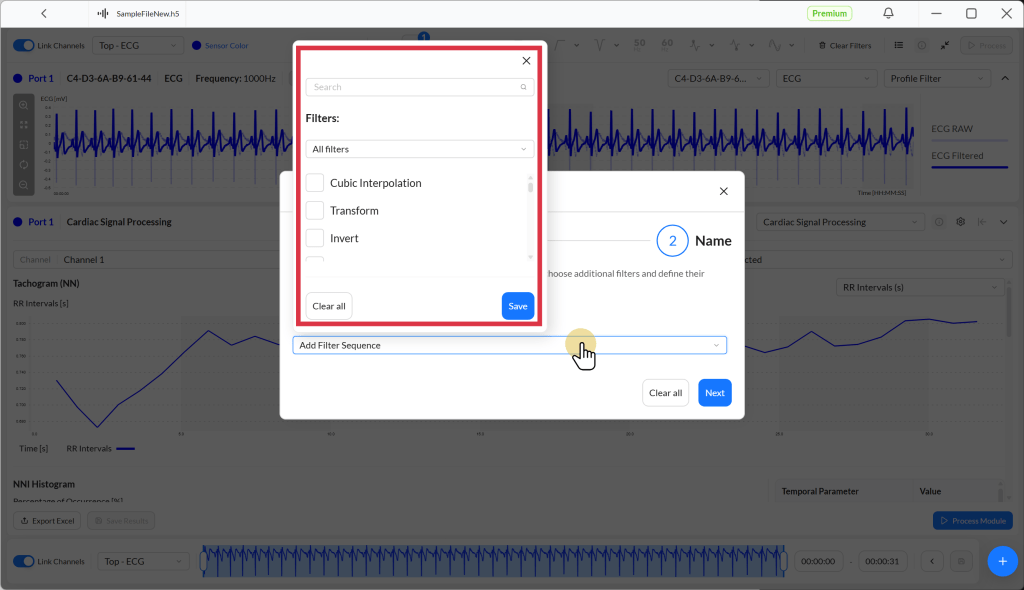
The selected filters are applied in the order you select them. Their application order is visualized as a blue number.
For example, in the selection below, the input signal will first pass through a Low-Pass (Butterworth) filter and then, in a second step, through a High-Pass (Butterworth) filter.
Click Save to finish the selection.
Configure your filters. You’ll find helpful tooltips that guide you through all available parameter inputs. Click on Next once you’re ready.
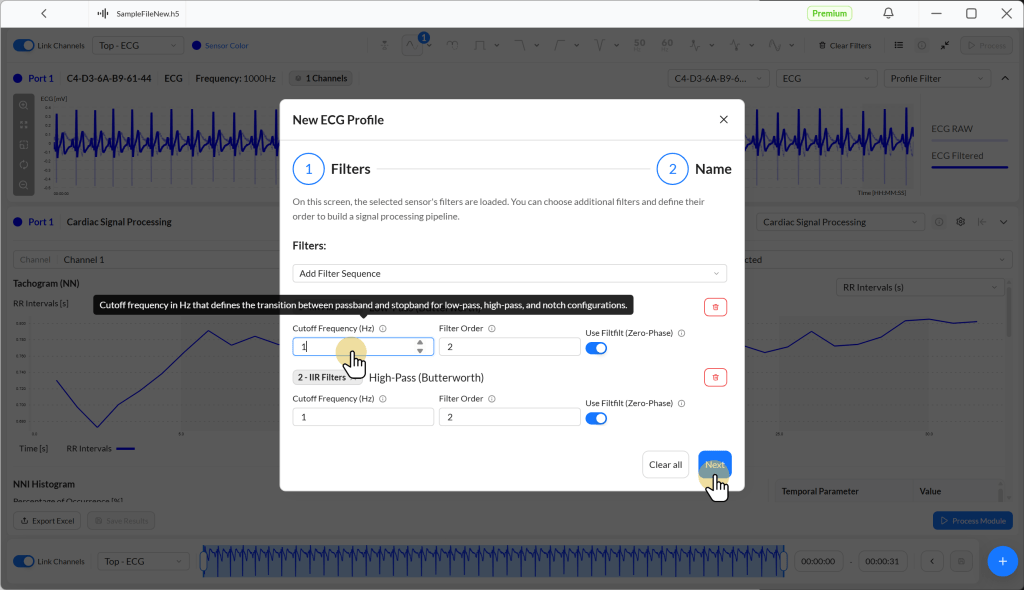
Name your Profile and click Create profile.

You’ll find your Profile in the Profile Filter menu. To apply your Profile, select the radio button next to it and click the Process button.
Selecting Input Signals & Applying Profiles
The input signals for the Signal Processing Toolbar are selected from the signal drop-down list in the top-right corner of the toolbar.
For sensors with a single signal, toolbar filters are automatically applied to that signal.
For signal bundles with multiple signals (such as accelerometers with separate X, Y, and Z axes), you can:
- Disable Link Channels to manually select which signals should be processed from the dropdown menu
- Enable Link Channels to apply filters to all signals simultaneously