

The Respiration Processing Module is a one-click signal processing module in Biosignals Studio for analyzing respiration signals recorded with inductive respiration sensors.
It cleans your respiration signal, detects breathing cycles, flags apnea phases, and extracts a complete set of respiration parameters, from breathing rate trends to breath-to-breath variability and inhalation/exhalation timing.
Paid Feature
This module is available with Biosignals Studio (Desktop) Academic & Commercial licenses and is not included in the free version of Biosignals Studio.
Learn more about the Biosignals Studio Academic License
Overview
The Respiration Processing Module:
- Displays the raw and filtered respiration signals, so you can quickly check signal quality, sensor drift, or posture-related artifacts
- Detects and highlights the peaks (end of inhalation) and valleys (end of exhalation) of each breath
- Plots a respiration rate tachogram showing how the breathing rate changes over time
- Automatically detects and highlights apnea phases, both after inhalation (breath held with full lungs) and after exhalation (breath held with empty lungs); not supported for biosignalsplux recordings (see why)
- Extracts respiration parameters for every individual breathing cycle and for the entire analyzed segment
The module is designed for the most common respiration research use cases, including cardiorespiratory coupling, sleep and apnea research, psychophysiology and stress monitoring, relaxation and breathing studies, and sports sciences (breathing control and recovery). It is also useful in ergonomics (breathing under workload) and fatigue or arousal studies.
New to processing modules? Learn how modules fit into your own custom processing pipeline:
Biosignals Studio: Signal Processing Pipeline Explained
Compatible Sensors & Systems

This module is compatible with the following inductive respiration sensors (Respiratory Inductance Plethysmography, or RIP for short):
- Respiration (RIP) Smart Sensor for Biosignals PRO
- Respiration (RIP) for biosignalsplux (apnea detection not supported, see why)
- respiBAN BLE
It is not compatible with piezo-electric respiration sensors (PZT) or BITalino systems.
Quick-Start Guide
Select Recordings (1) in the Biosignals Studio side menu and open your respiration recording (2).
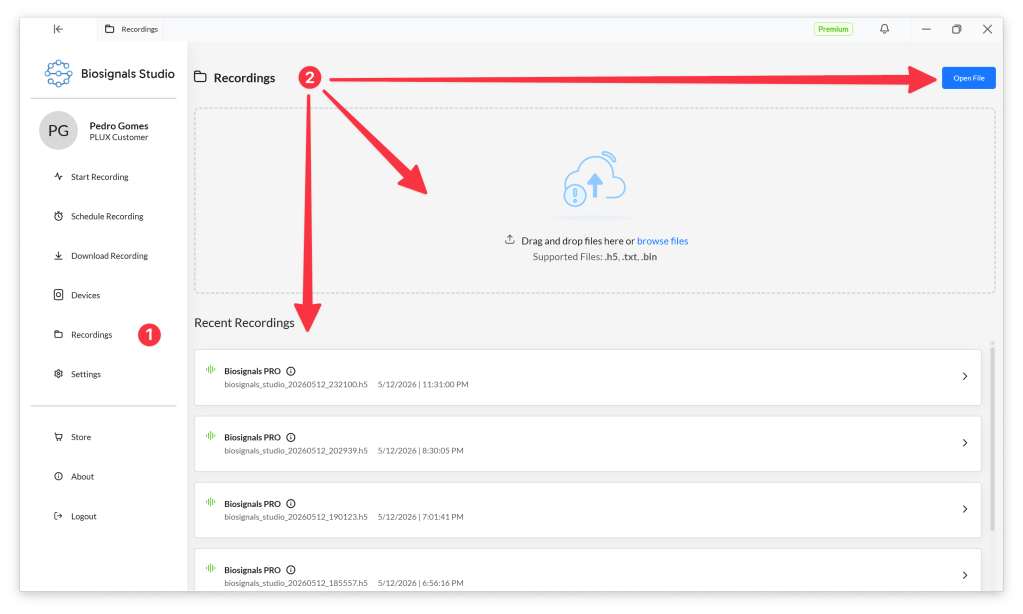
Select the respiration signal you want to process and press the Process button (3) next to it.

Biosignals Studio automatically suggests the Respiration Processing Module for respiration channels. Click Process Module (4) to start the signal processing.

The results are displayed in the lower half of the screen.
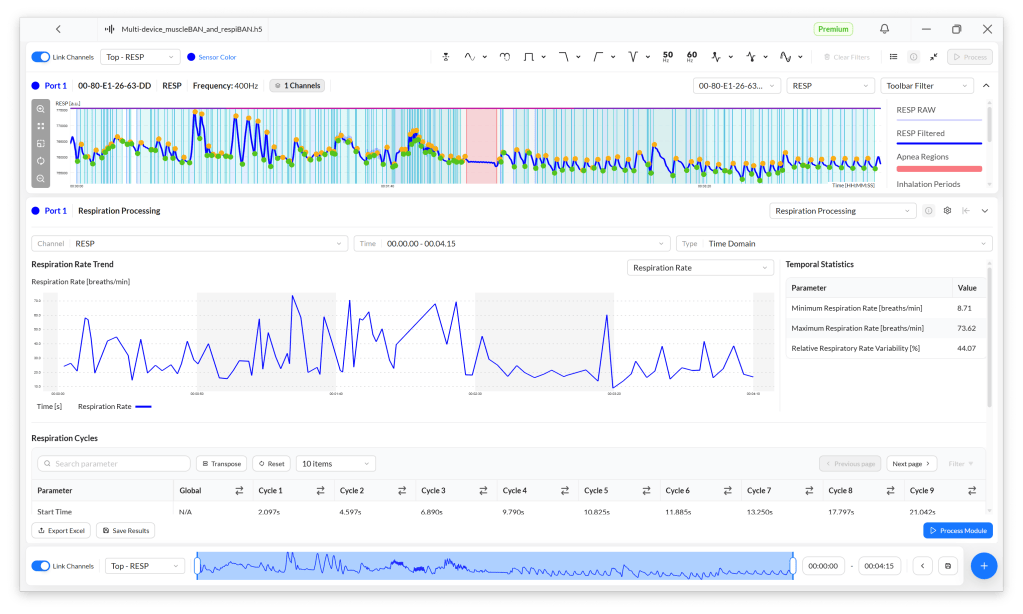
Pre-Processing
Before extracting any parameters, the module pre-processes the respiration signal and identifies the individual breathing cycles in the following steps.
Band-pass filtering
The respiration signal is filtered with a 4th order Butterworth band-pass filter (0.05 Hz to 1 Hz).

This removes slow baseline drift and higher-frequency noise while preserving the shape of the breathing waveform. The upper cut-off of 1 Hz corresponds to 60 breaths per minute, which covers resting, relaxed, and most exercise breathing.
Signal normalization (optional)
Normalization scales the respiration signal to a range from 0 to 1. This reduces the impact of sensor placement, which affects the signal’s offset and amplitude, on your results.
Normalization is useful when comparing results between participants, or between different recordings of the same participant, where the sensor may not have been placed in exactly the same way. It is disabled by default.
⚠️ Signal disappeared or flat at zero after processing?
Check that Signal normalization is disabled in the module settings.
Inductive respiration sensors have a 24-bit resolution, and depending on the participant and sensor placement, the raw signal can span ranges from a few dozen to tens of thousands of units. Normalization maps this to a range from 0 to 1, so next to the raw signal values, the normalized signal can look as if it dropped to zero or is stuck to the bottom of the graph.
Peak and valley detection
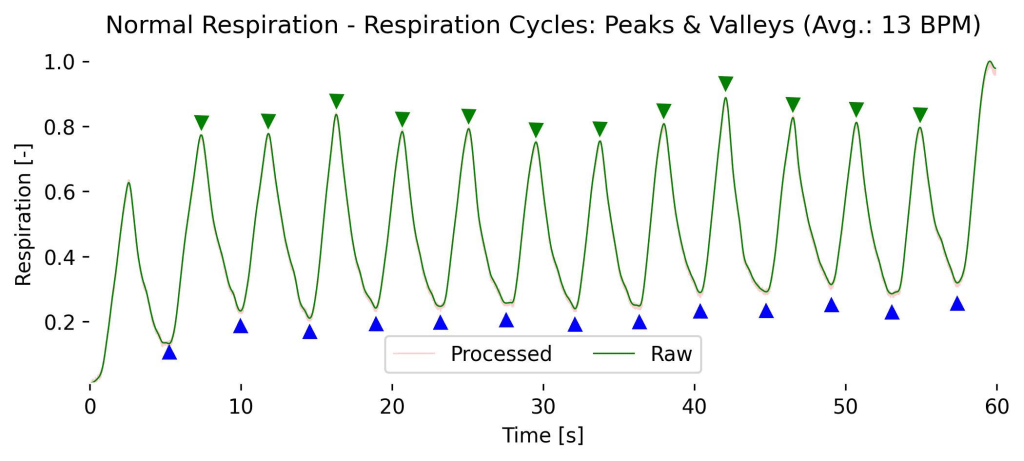
The module detects the two turning points of every breath:
- Peaks: the transition from inhalation to exhalation
- Valleys: the transition from exhalation to inhalation
To avoid false detections from small signal fluctuations, a peak (or valley) is only accepted if it is separated from the previous one by at least the refractory period (default: 0.8 s), stands out clearly from the surrounding signal (minimum prominence), and is at least approximately 200 ms wide.
Breathing cycle definition
A full breathing cycle can be defined in two ways, selectable in the module settings:
- Valley (default): from the start of inhalation to the end of exhalation (valley to valley)
- Peak: from the start of exhalation to the end of inhalation (peak to peak)
Cycle correction
Only complete breathing cycles are analyzed. Peaks or valleys at the start or end of the analyzed segment that belong to an incomplete cycle are automatically excluded, so partial breaths do not distort your results.
Apnea detection
Apnea phases (periods with no breathing movement) are detected automatically, whether they result from a breath-hold protocol or occur naturally, for example during sleep. Unidentified apnea phases would otherwise distort the breathing rate and breath-to-breath interval results.
During an apnea, the respiration signal stays nearly flat. The module detects these phases by comparing the slope of the signal with its local average slope, and accepts flat sections that last at least the minimum apnea duration. You can fine-tune this behavior in the module settings.
⚠️ Apnea detection is not supported for biosignalsplux recordings
The biosignalsplux Respiration (RIP) sensor only measures changes in chest or abdomen circumference while they happen. When the breath is held, its signal does not stay at the last inhaled or exhaled level; instead, it slowly returns to the signal baseline. Apnea phases therefore do not appear as the flat segments this module looks for.
As a result, apnea detection on biosignalsplux recordings can miss apnea phases, place them at the wrong time, or flag normal breathing as apnea. Breathing cycles and respiration parameters from segments that contain breath-holds may also be affected.
Learn more about how the biosignalsplux RIP sensor behaves during apnea:
How can I identify Apnea Phases using Inductive Respiration (RIP) Sensor?
Module Settings
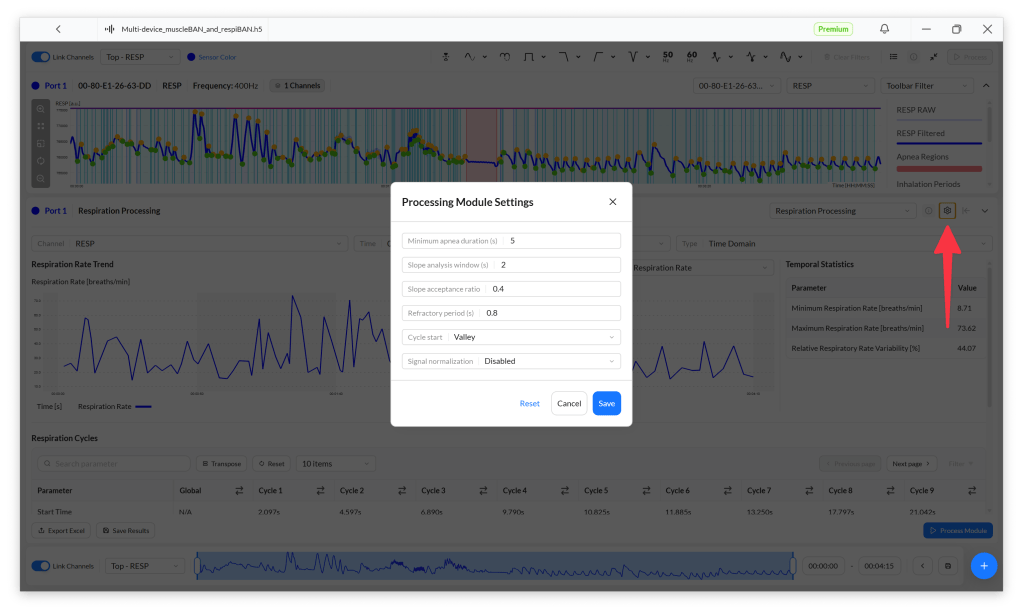
The Processing Module Settings window lets you adjust how the module detects breathing cycles and apnea phases. Use Reset to restore the default values.
| Setting | Default | Description |
|---|---|---|
| Minimum apnea duration | 5 s | Minimum time a flat signal section must last to be detected as an apnea phase. Increase it to ignore short pauses between breaths; decrease it to detect shorter breath-holds. |
| Slope analysis window | 2 s | Length of the window used to compute the local average slope of the signal, which serves as the adaptive reference for apnea detection. Smaller windows make detection more sensitive but increase the risk of false positives; larger windows make it less sensitive. |
| Slope acceptance ratio | 0.4 | Fraction of the local average slope below which the signal counts as flat. Lower values narrow the detected apnea phase; higher values accept a wider segment. This prevents apnea phases from overlapping with correctly detected peaks or valleys. |
| Refractory period | 0.8 s | Minimum time between two consecutive peaks (or valleys). Prevents small fluctuations from being detected as additional breaths. With 0.8 s, the highest detectable breathing rate is 75 breaths/min. |
| Cycle start | Valley | Defines where each breathing cycle begins: Valley (start of inhalation) or Peak (start of exhalation). |
| Signal normalization | Disabled | Scales the signal to a range from 0 to 1 to reduce the impact of sensor placement when comparing participants or recordings. See Signal normalization above before enabling it. |
💡 Tip
The default values work well for most recordings. Adjust the apnea settings only if apnea phases are visibly missed, detected during breathing, or cut too short, and adjust the refractory period only if breaths are visibly missed or double-counted.
Respiration Parameters
The module extracts two types of results:
- Temporal statistics: computed over the entire analyzed segment
- Cycle parameters: computed for every individual breathing cycle
Both are based on the following data series:
| Series | Unit | Description | In practice |
|---|---|---|---|
| Respiration Rate (RR) series | breaths/min | Breathing rate of each consecutive breathing cycle, shown in the tachogram. | Shows how your participant’s breathing speeds up or slows down over time. |
| Breath-to-Breath Interval (BBI) series | s | Duration between consecutive breaths, used to compute the variability parameters below. | The breathing equivalent of the RR-interval series in HRV analysis. |
Temporal Statistics
The dropdown list at the top of the module gives you access to two types of temporal statistics:
- Respiration Rate parameters
- Breath-to-Breath Interval (BBI) parameters
These metrics are computed over the entire time window of the selected processing segment.
Respiration Rate Parameters

These parameters are extracted from the respiration rate series (breaths/min). The graph shows how the respiration rate evolves over the analyzed period.
| Parameter | Unit | Description | In practice |
|---|---|---|---|
| Minimum Respiration Rate | breaths/min | Lowest breathing rate in the RR series. | The slowest your participant breathed during the segment. |
| Maximum Respiration Rate | breaths/min | Highest breathing rate in the RR series. | The fastest your participant breathed during the segment. |
| Relative Respiratory Rate Variability | % | Standard deviation of the respiration rate relative to its mean (coefficient of variation). | Higher values mean the breathing rate fluctuated more during the segment; useful for comparing segments or participants with different average breathing rates. |
Breath-to-Breath Interval (BBI) Parameters
BBI parameters are extracted from the intervals (in seconds) between the starts of consecutive breathing cycles. They are similar to the time-domain metrics of Heart Rate Variability (HRV) analysis in ECG.
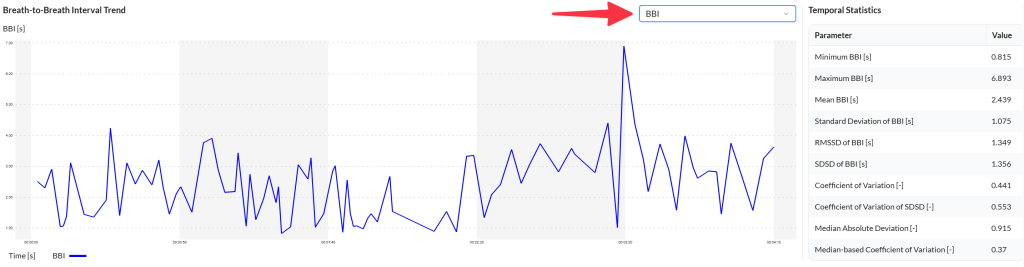
| Parameter | Unit | Description | In practice |
|---|---|---|---|
| Minimum BBI | s | Shortest breath-to-breath interval. | The shortest breath in the segment. |
| Maximum BBI | s | Longest breath-to-breath interval. | The longest breath in the segment. |
| Mean BBI | s | Average breath-to-breath interval. | The typical breath duration; 60 / Mean BBI gives the average breathing rate. |
| SD BBI | s | Standard deviation of all breath-to-breath intervals (overall variability). | Higher values mean a more irregular breathing rhythm across the whole segment. |
| RMSSD | s | Root mean square of successive differences between consecutive BBIs (short-term variability). | Higher values mean larger changes from one breath to the next, e.g., due to sighs, talking, or arousal. |
| SDSD | s | Standard deviation of successive differences between consecutive BBIs. | Higher values mean the breath-to-breath changes themselves are less consistent. |
Breathing Cycle Parameters
The following parameters are extracted for each individual breathing cycle. For all non-timestamp parameters, the module also reports the mean and standard deviation across all cycles in the analyzed segment (e.g., mean cycle duration ± SD).
| Parameter | Unit | Description | In practice |
|---|---|---|---|
| Cycle Start | s:ms | Timestamp at which the breathing cycle begins (valley or peak, depending on the cycle start setting). | Lets you locate each breath in your recording. |
| Cycle End | s:ms | Timestamp at which the breathing cycle ends. | Lets you locate each breath in your recording. |
| Cycle Duration | s | Total duration of the breathing cycle. | How long one full breath took. |
| Respiration Rate | breaths/min | Breathing rate computed from the duration of this cycle. | The breathing rate at that specific moment. |
| Inhalation Duration | s | Time from valley to peak within the cycle. | How long your participant took to breathe in. |
| Exhalation Duration | s | Time from peak to valley within the cycle. | How long your participant took to breathe out. |
| Inhale-to-Exhale Ratio (I:E) | – | Inhalation duration divided by exhalation duration. | Values below 1 mean exhalation is longer than inhalation, as is typical at rest; values near or above 1 point to faster, more effortful, or deliberately controlled breathing. |
| Transition Point | s | Point within the cycle where inhalation turns into exhalation (or vice versa, depending on the cycle start setting). | Shows where in each breath the switch between breathing in and breathing out happens. |
Tips & Tricks
Jump to the parameters of a specific cycle
In longer recordings, it can be difficult to find the metrics of a specific breathing cycle in the middle of your signal. Click directly on the respiration signal to highlight the selected cycle and its metrics.

The graph zooms in on the selected cycle and the results table jumps to the cycle’s entry.

Process multiple time windows in the same recording
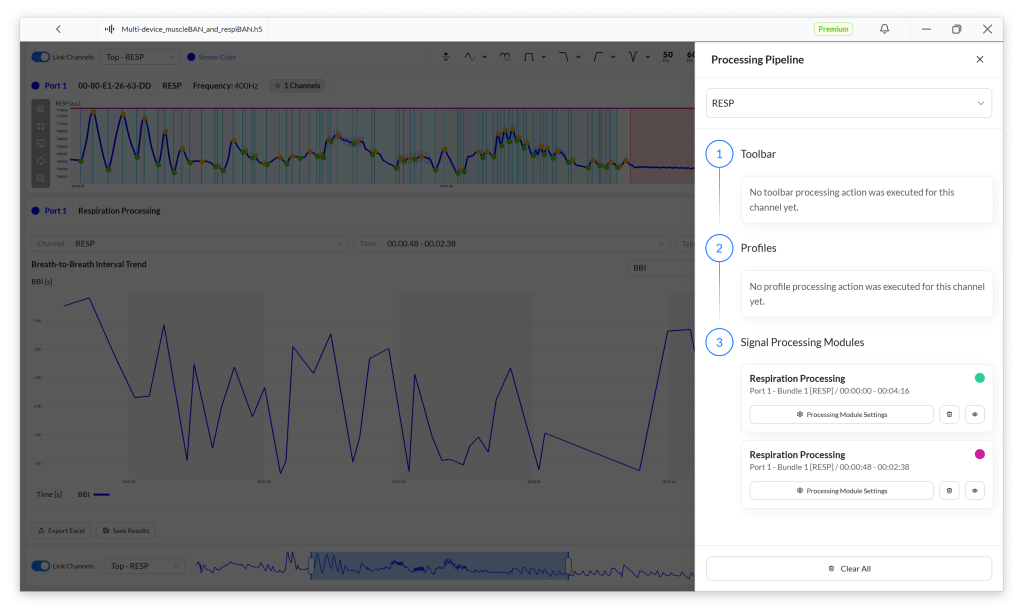
You can apply the processing module to different segments of your recording. This is particularly useful if a single recording contains multiple phases, for example, a baseline at the beginning and a respiration task under different conditions at the end.
To do this, adjust the time window using the time axis at the bottom of the screen, then click Process after each selection.

Biosignals Studio does not overwrite previously processed time windows. Instead, you’ll find all processed segments in the Time dropdown menu at the top of the module.

To delete a processed segment, click the list icon in the toolbar at the top of the screen and use the trash can icon next to the segment.
Datasheet
The datasheet describes the module’s technical implementation in detail, including the pre-processing steps, the formulas used to compute each parameter, and the referenced scientific literature.
