
Biosignals Studio records all your sensor data, computed metrics, and processing results using the HDF5 (Hierarchical Data Format) (often also shortened to the .h5 file ending).
This format provides a structured, efficient, and reliable way to store large, multi-channel biosignal datasets together with their corresponding metadata.
Unlike the plain text format used in OpenSignals, HDF5 organizes all information in a single file, including:
- signal data (raw & processed)
- timestamps (in epoch format)
- sensor configurations
- processing results (from processing modules, ex: Heart Rate Variability (HRV))
- events
- and annotations
This structure not only ensures data integrity but also makes it easier to manage, share, and reanalyze experiments.
Opening HDF5 Files
You can open Biosignals Studio recordings in Biosignals Studio or using the HDF5 Viewer (used in the examples below) provided by the HDF5 Group.
The HDF5 viewer can be downloaded for free (requires registration on the HDF5 website):
You can also open the file in data analysis environments, including Python (via h5py), MATLAB (native), and R.
Overview of the File Structure
The Biosignals Studio HDF5 file follows a structured, hierarchical layout that mirrors the architecture of the Biosignals PRO 10-port acquisition system.
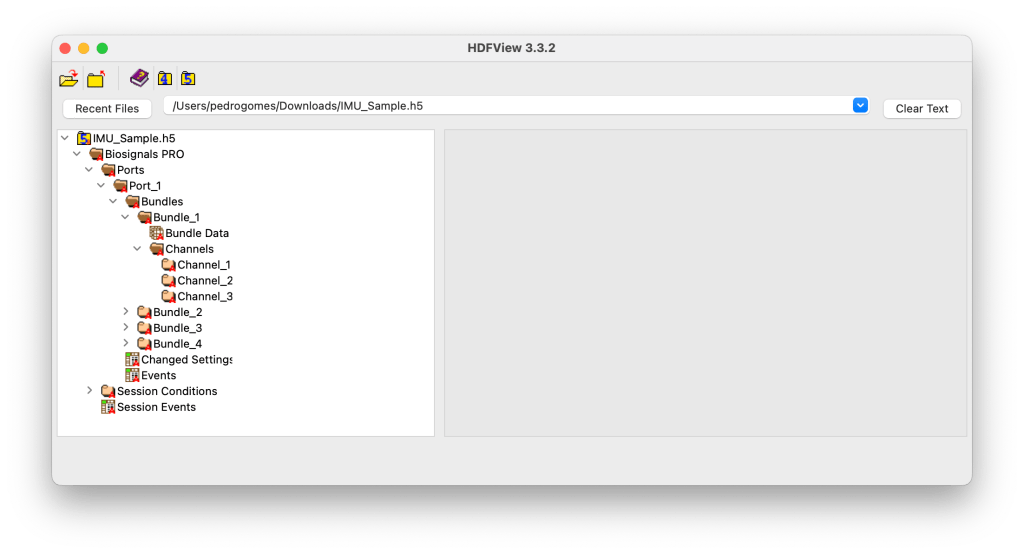
Each level of the hierarchy corresponds to a specific layer of information, from overall session metadata to individual signal channels, ensuring modular access and compatibility across different sensor configurations.
| Level | Category | Description | Example |
|---|---|---|---|
| 1 | Biosignals PRO | Overall device and recording metadata | Firmware 0.8.0, 1 port active |
| 2 | Ports | List of connected sensors | Port 1 |
| 3 | Port_N | Sensor metadata | IMU, 4 bundles |
| 4 | Bundles_Y | Sub-sensor groups | Bundle_1 = ACC, Bundle_2 = GYR, etc. |
| 5 | Bundle Data | Recorded samples | 22,950 samples |
| 6 | Channels | Data axes | X, Y, Z |
| 7 | Channel_Z | Channel calibration and unit | ACC X, unit = g |
Sensor Signal Information & Content at Each Level
The examples below where used from an IMU recording. While the general structure of the file content remains the same for other sensor signals, specific parameters may change.
Level 1: Global Device & Session
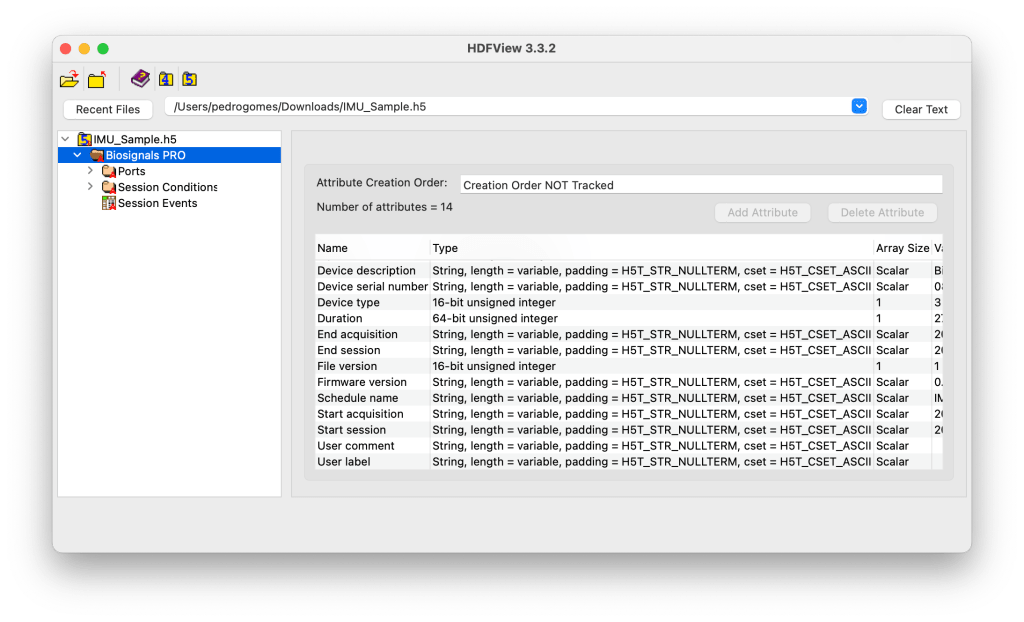
This is the root group containing global session and device metadata. It defines the acquisition context, including the device description, serial number, firmware version, file version, and acquisition timestamps and other global recording metadata.
It also references all active ports and session-related groups such as Session Conditions and Session Events.
Example Content
Device Description: Biosignals PRO
Device Serial Number: 08-40-20-17-01-0000
Firmware Version: 0.8.0
Start Acquisition: 2025/10/22 12:57:51.046
End Acquisition: 2025/10/22 12:58:18.784
# Ports: 1
Subgroups:
- Ports → Lists all active ports with connected sensors
- Session Conditions → Stores environmental or setup conditions
- Session Events → Logs experimental events and markers
Level 2: Port Information (Ports)
The Ports group lists all ports that were active during the acquisition. Each port corresponds to a physical input on the device and contains all information and data related to the sensor connected to that port.
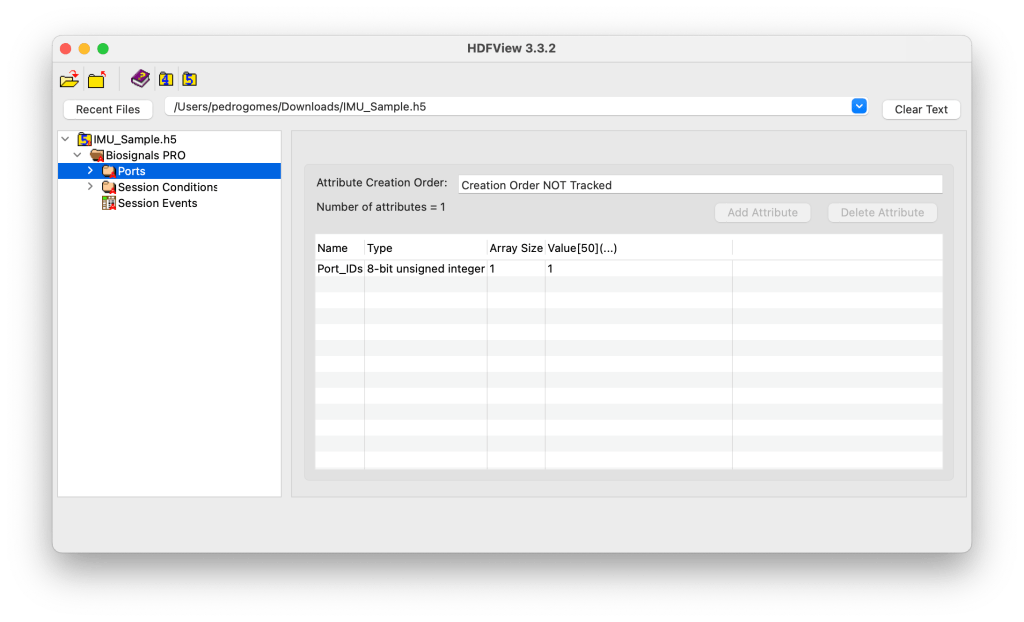
For example, a Biosignals PRO (10-port system) may contain groups Port_1 to Port_10, but only active ports are instantiated in the file.
Example Content
Port_IDs = [1] → Only Port 1 is active in this session.
Level 3: Port-Specific Information (Port_X)
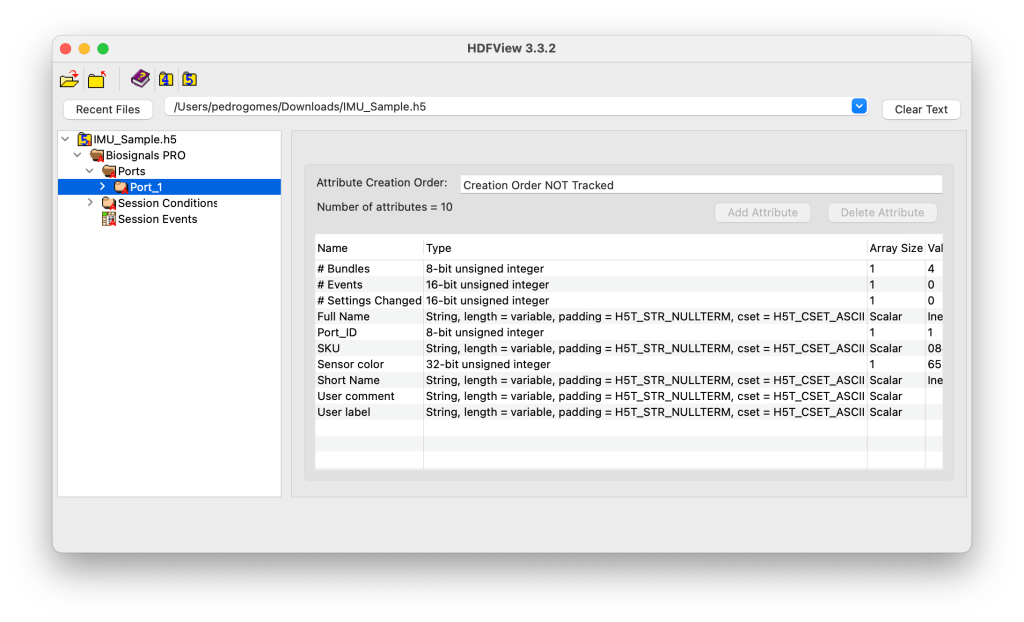
Each Port_X group stores the sensor metadata and its recording data.
This includes information such as the sensor name, SKU, color ID, number of bundles, and user-defined labels.
It may also include sensor-specific events and configuration changes recorded during the session.
Example Content
Example Metadata:
Sensor Color: 65280 (corresponds to LED color in RGB code)
Full Name: Inertial Measurement Unit
Short Name: IMU
SKU: 08-28-14-0C-01
# Bundles: 4
Subgroups:
- Bundles → Sensor data grouped by sub-sensor type
- Changed Settings → Records configuration changes during acquisition
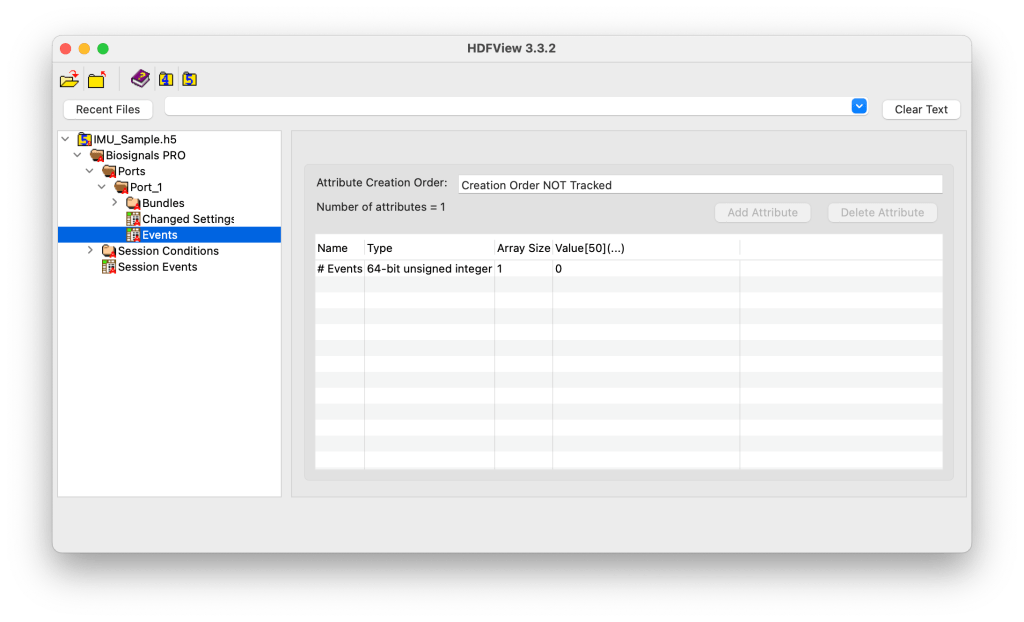
- Events → Logs sensor-specific events
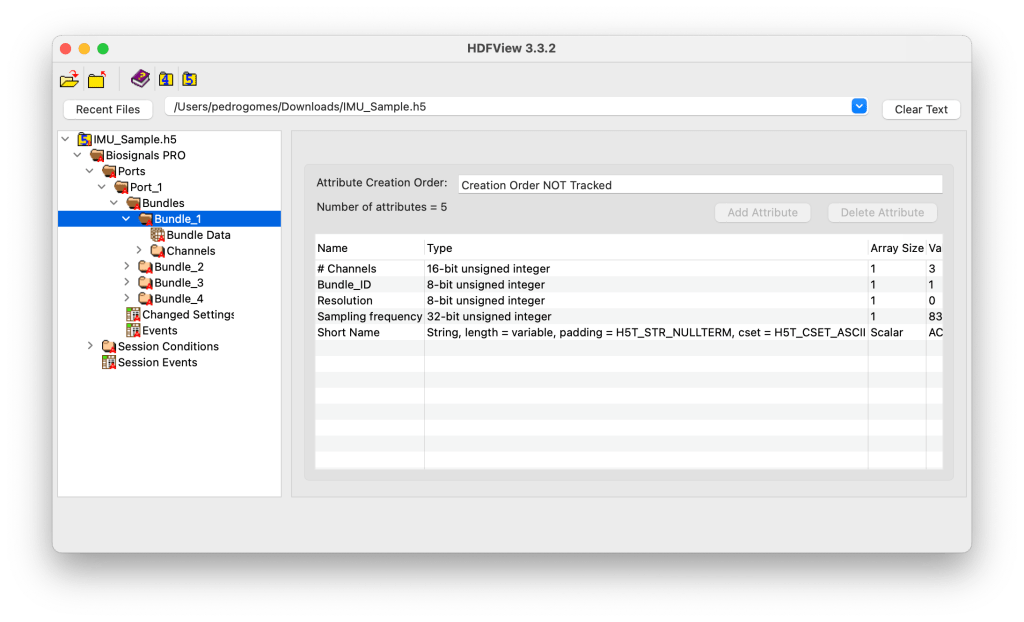
Level 4: Bundles

The Bundles subgroup contains all sub-sensor data streams (or computed metrics) associated with the connected sensor.
Each bundle represents a distinct data source, for example, the Accelerometer, Gyroscope, Magnetometer, or Motion Score in an IMU. Metadata at this level describes the number of bundles available and their IDs.
Example Content
Bundle_IDs = [1, 2, 3, 4] → 4 active bundles for the IMU.
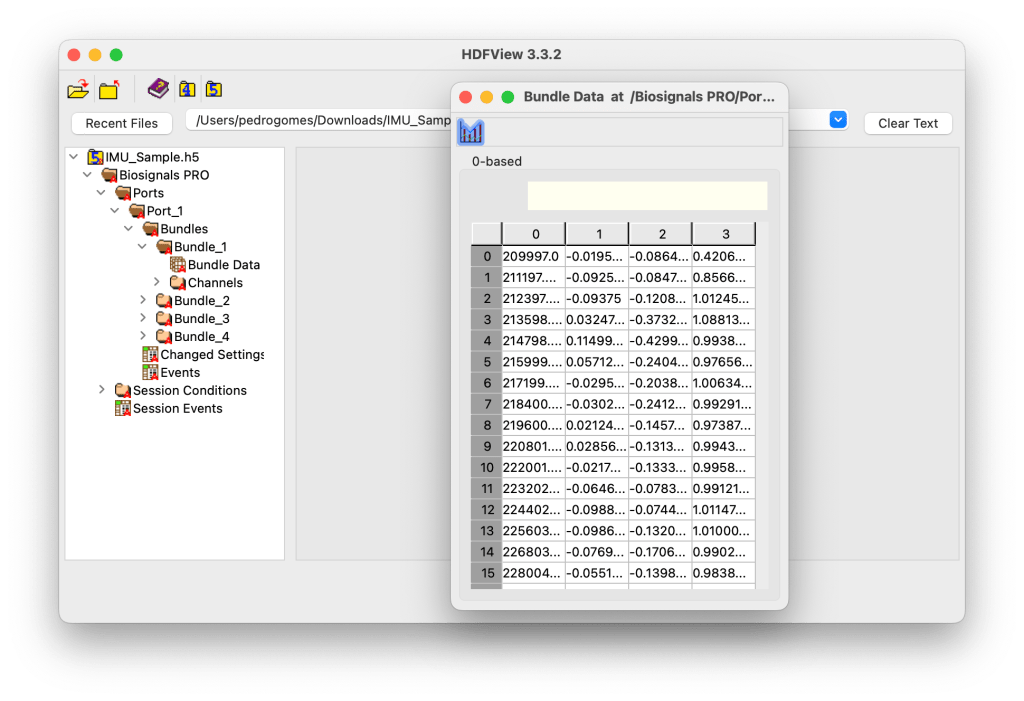
Level 5: Bundle-Specific Content (Sensor Signals)
⚠️ Here is where you find your sensor signals!
Each Bundle_X group holds the actual recorded data from a specific sub-sensor. The Bundle Data dataset within it contains the sampled signal values and related attributes such as:
- Number of samples
- Sampling duration (in nanoseconds)
- Channel labels (e.g., Timestamp, X, Y, Z)
This level effectively represents the raw biosignal data captured during acquisition.
Example Content
# Samples: 22,950
Channel Labels: Timestamp, X Ax, Y Ax, Z Ax
Duration (ns): 27,569,133
Level 6: Channels

The Channels group defines the structure of the sub-sensor’s output by listing all individual data channels (axes or metrics).
Each entry (Channel_1, Channel_2, etc.) corresponds to one physical or computed output channel.
Example Content
Channel_IDs = [1, 2, 3] → Three channels corresponding to X, Y, and Z axes.
Level 7: Channel_Y
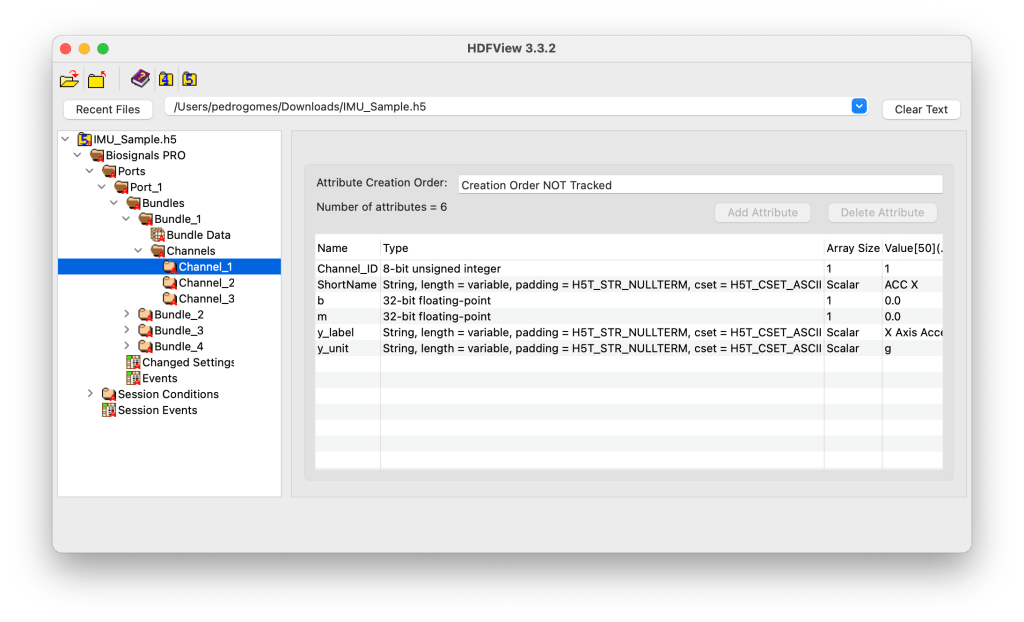
Each Channel_Y group contains channel-specific metadata and calibration parameters used for signal interpretation and conversion.
Attributes include:
- Channel ID and short name
- Scale (
m) and offset (b) factors - Channel label and measurement unit (e.g., g, m/s², °/s)
Together, these parameters define how raw numerical data should be converted into meaningful physical units.
Example Content
Channel_ID: 1
Short Name: ACC X
y_label: X Axis Acceleration
y_unit: g
m: 1.0 (scale factor)
b: 0.0 (offset)
Recording Session Conditions
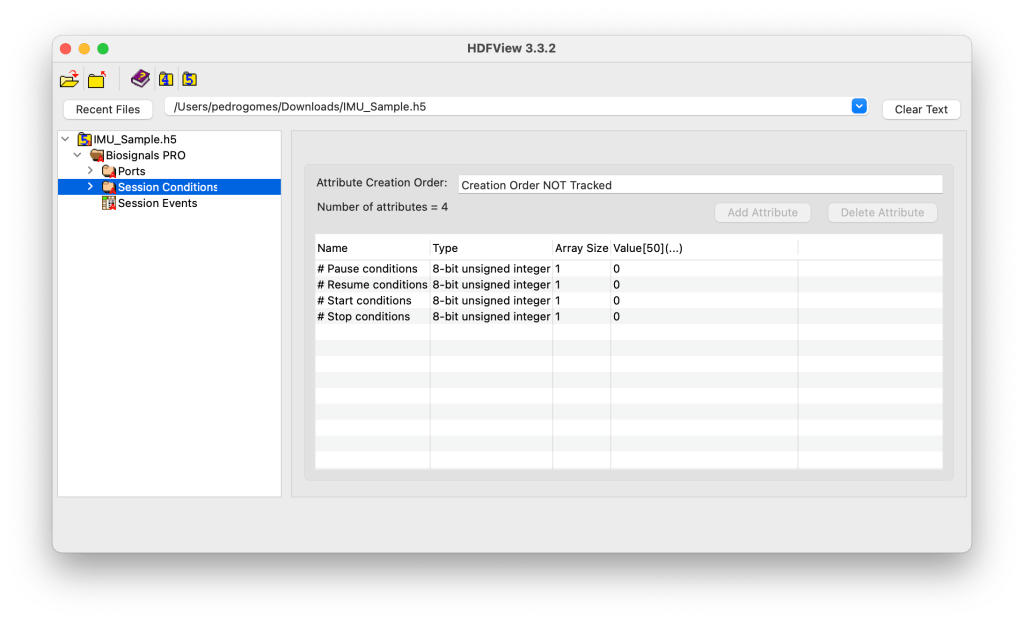
The Session Conditions group defines the acquisition control logic used during the recording. It stores the metadata for all automatic or user-defined conditions that can start, pause, resume, or stop the acquisition process in Biosignals Studio or on a Biosignals PRO device itself.
Each condition type is stored as a subgroup (e.g., Start Conditions, Pause Conditions), while the main Session Conditions group contains attributes summarizing their count.
Attributes:
| Name | Type | Description | Examples |
|---|---|---|---|
# Start conditions | 8-bit unsigned integer | Number of conditions configured to trigger the start of a recording | Start at 2 pm |
# Pause conditions | 8-bit unsigned integer | Number of conditions that pause the recording | Stop after 30 seconds |
# Resume conditions | 8-bit unsigned integer | Number of conditions that resume a paused recording | Resume recording when high motion activity is detected |
# Stop conditions | 8-bit unsigned integer | Number of conditions that stop the recording & close the session | Stop at 3 pm or via Biosignals Studio command |
If any value is set to 0, it indicates that no automatic conditions were active during this recording.
Recording Events
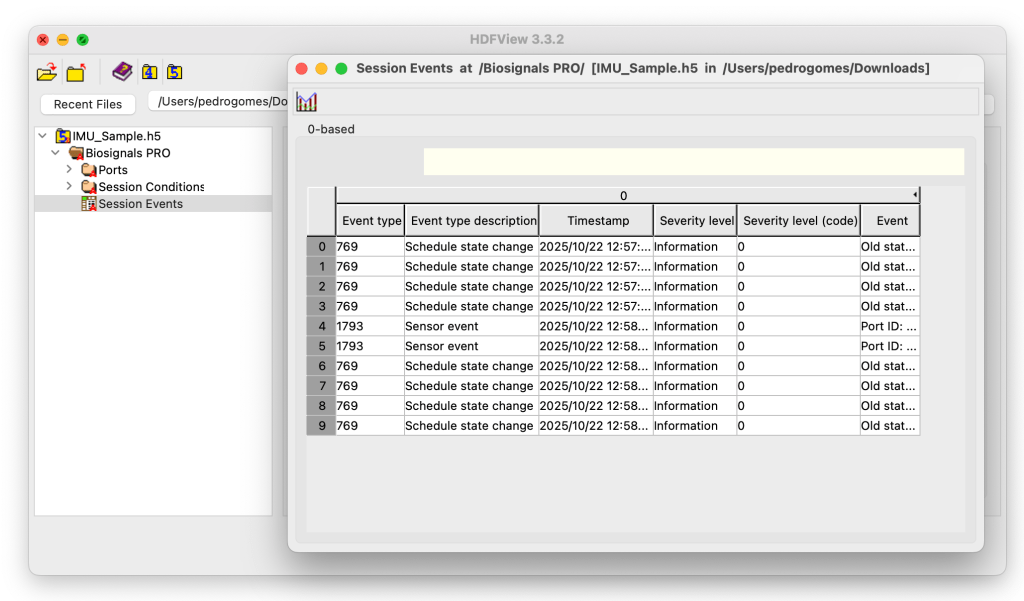
The Session Events group logs all device-level and major sensor events (ex: sensor disconnect) that occurred during the recording session.
This dataset provides a chronological record of state transitions, system notifications, and hardware interactions that trigger events and influence signal acquisition or device behavior.
Each event is stored with a timestamp, event type, description, and severity level, allowing you to trace back operational states and troubleshoot anomalies during data collection.
Typical Event Categories:
- Informational: General system or state updates, such as:
- Device transitioning from idle to recording mode
- Recording paused or resumed
- Schedule state changes
- Sensor disconnection or communication failure
- Warning: Events that do not interrupt acquisition but may affect quality or performance, such as:
- Low battery notifications
- Temporary data transfer delays
- Error: Events that interrupt or degrade data acquisition, such as:
- Hardware malfunction
Dataset Columns:
| Field | Description |
|---|---|
Event type | Numeric identifier for the event category. |
Event type description | Human-readable explanation of the event (e.g., “Schedule state change”, “Sensor event”). |
Timestamp | Exact time when the event occurred during the acquisition. |
Severity level | Text description of the event severity (“Information”, “Warning”, “Error”). |
Severity level (code) | Numeric representation of severity (0 = Info, 1 = Warning, 2 = Error). |
Event | Additional event details, such as port ID, sensor reference, or previous state. |
Signal Processing Results
Biosignals Studio offers signal processing module for various sensors. The results of this process is also stored in the H5 file, along with the raw sensor data.
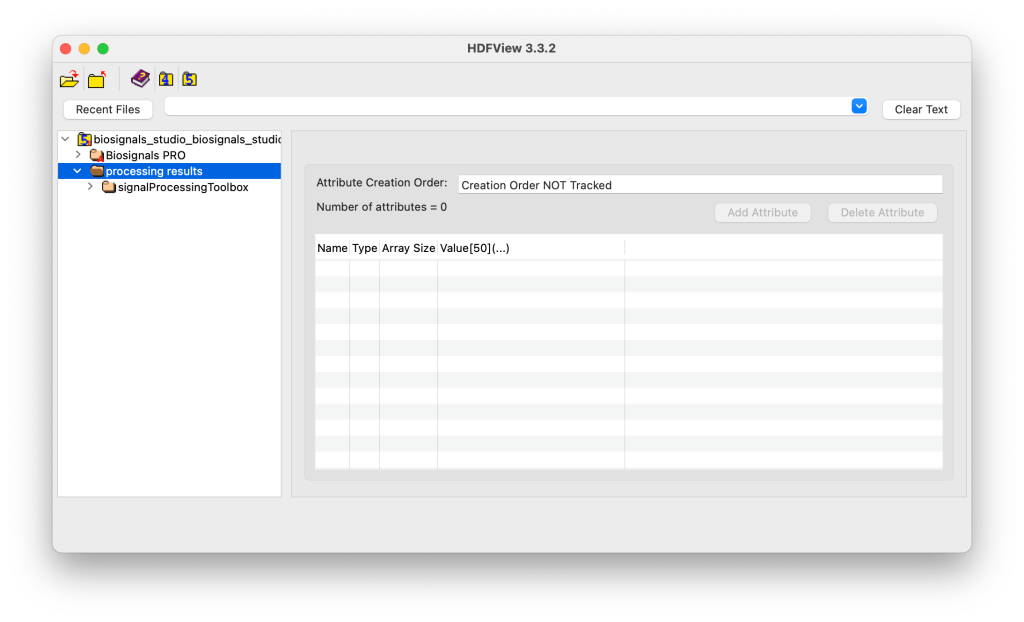
The processing results, including both extracted parameters and processed sensor signals are stored under Processing Results and the respective processing module used to process the sensor data.
The originals sensor data continues to be stored separately under the available device(s) of your H5 files. By design, this separation ensures that:
- The raw data remains untouched and can always be used as a backup or for reprocessing
- The processing results can be stored, versioned, and accessed independently from acquisition data.
This modular structure allows different processing pipelines or analysis tools to store their outputs within the same HDF5 file, maintaining traceability between raw signals and their derived data.
Example Content
Biosignals PRO → Contains original sensor recordings (raw signals).
processing results/signalProcessingToolbox → Contains processed versions of those signals (e.g., filtered, segmented, or feature-extracted data).
FAQs
Where can I find my sensor signals?
Sensor data is stored in the Bundle Data containers found in
Device > Ports > Port # > Bundles > Bundle # > Bundle Data
along with their respective timestamps.
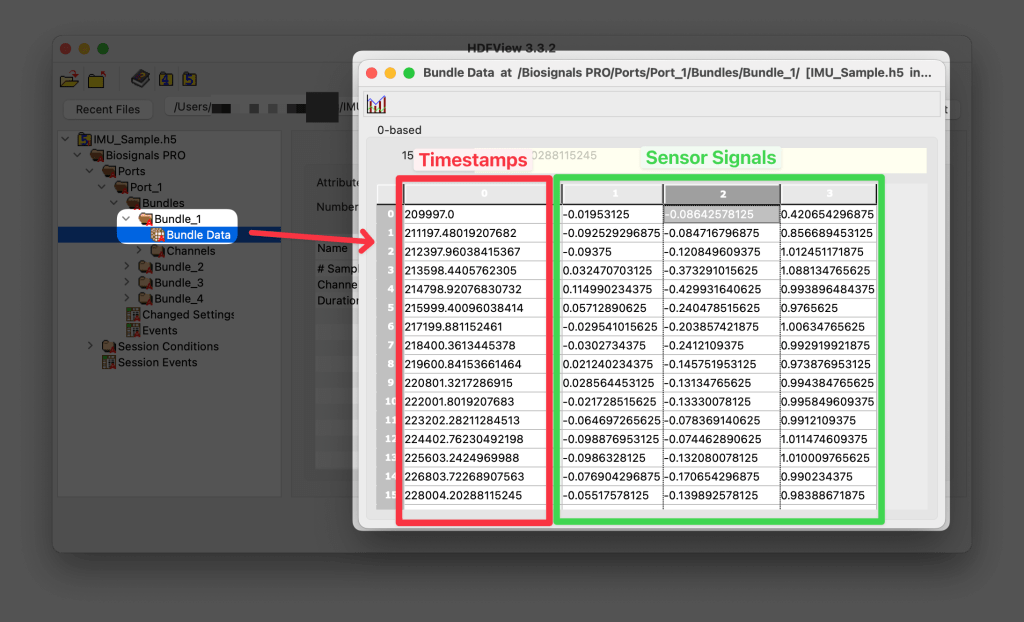
Are timestamps stored as sequence numbers?
No, sensor data from all devices are stored with Epoch timestamps and can be found in the Bundle Data containers (column 0).