
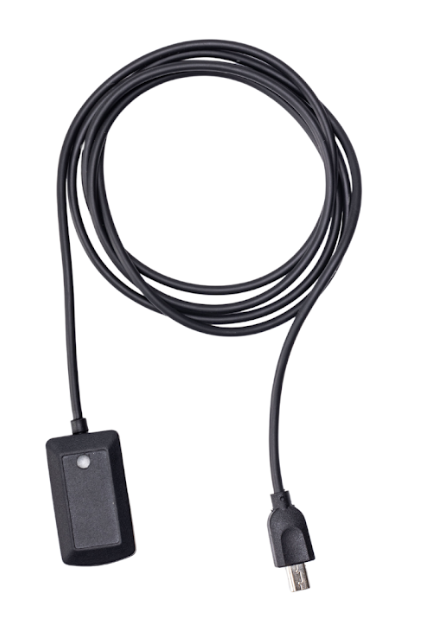
The Inertial Measurement Unit (IMU) captures detailed information about motion and orientation in space. It combines a 3-axis accelerometer, a 3-axis gyroscope, and a 3-axis magnetometer to provide a complete picture of movement and position in three dimensions.
It also includes a new metric named Motion Score, which uses accelerometry and gyroscope data to compute a motion intensity level metric.
This article explains how to connect, configure, and start recording data with the Inertial Measurement Unit (IMU) sensor for Biosignals PRO systems.
Compatible Systems
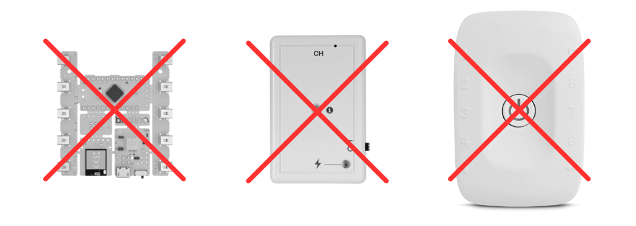
This sensor is exclusively compatible with Biosignals PRO systems.

This sensor is not compatible with any biosignalsplux or BITalino devices.
Recommended Setup
To complete this setup, you will need:
- 1x Biosignals PRO device
- 1x IMU Sensor
- Biosignals Studio (Desktop)
- Sports tape or skin-friendly adhesive (optional)
Connecting the Sensor to Your Biosignals PRO
Connect the sensor to any of the available Biosignals PRO ports.
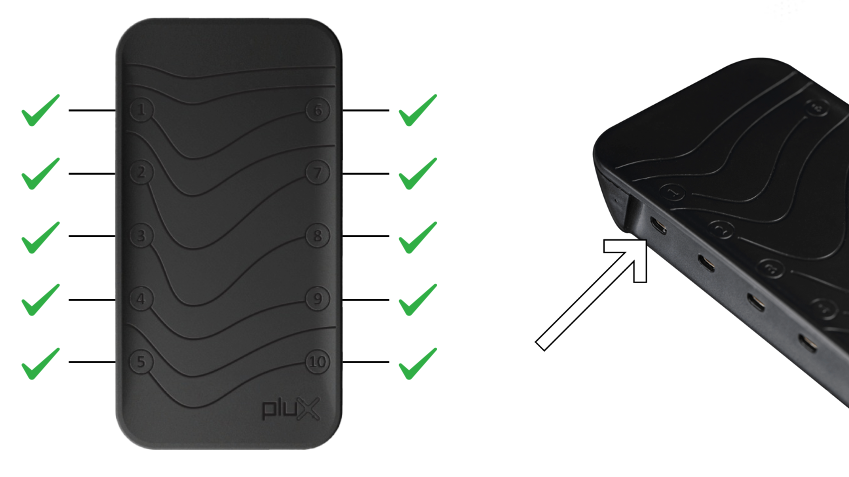
Once connected, the system will recognize the sensor, configure everything automatically, and activate it.
You can also see the sensor in the Biosignals Studio device settings, where it is listed as an IMU sensor on the connected port.

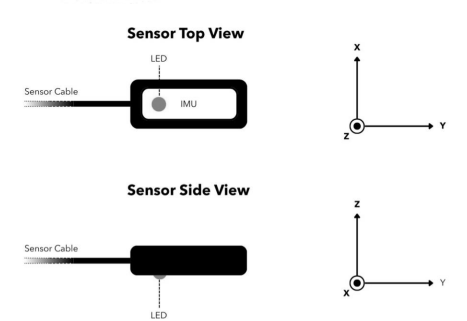
Sensor Axis Orientation
Applying the Sensor
The IMU sensor doesn’t require any specific positioning as it can capture motion data from any body part. This sensor does not require direct skin contact.
Place the sensor on the body part you want to measure motion data from and secure the sensor in place with sports tape or other skin-friendly medical-grade adhesive of your choice.
Sensor Signals Interpretation & Samples
The following examples show typical signal patterns recorded with the IMU sensor during controlled motion and rotation scenarios. Each graph highlights how the different sensor outputs respond to changes in movement intensity, angular rotation, and sensor orientation. These examples can help you better understand how accelerometer, gyroscope, and magnetometer signals behave during real-world recordings and how motion characteristics appear in the raw sensor data.
Accelerometer (ACC)
This recording shows the accelerometer response during movements with different intensities. Lower-intensity movements generate smaller oscillations, while stronger movements produce larger acceleration peaks across the sensor axes.

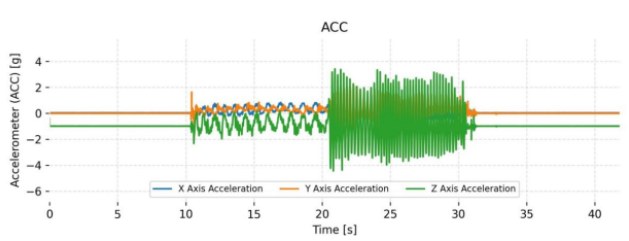
Raw accelerometer data showing different movement intensities
Gyroscope (GYRO)
This recording shows the gyroscope response during rotational movements around different axes. Each signal reflects angular velocity changes associated with pitch, roll, and yaw movements.

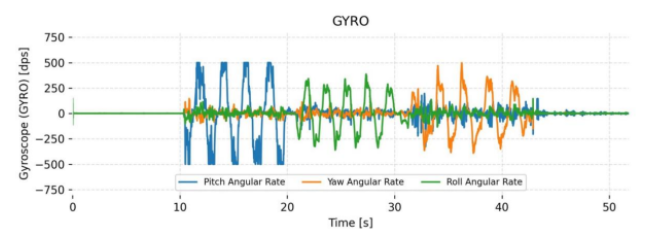
Raw gyroscope data showing pitch, roll, and yaw rotations
Magnetometer (MAG)
This recording shows the variation of the magnetic field measurements while changing the sensor orientation. The smooth signal transitions reflect the sensor rotation relative to the Earth’s magnetic field.

Raw magnetometer data
An example of the Motion Score metric computed from the Accelerometer and Gyroscope signals. The recording demonstrates different motion-intensity levels, where low-intensity movements generate lower Motion Score values, and more dynamic movements result in higher scores. This metric provides a compact representation of overall motion intensity without requiring the analysis of all raw IMU channels
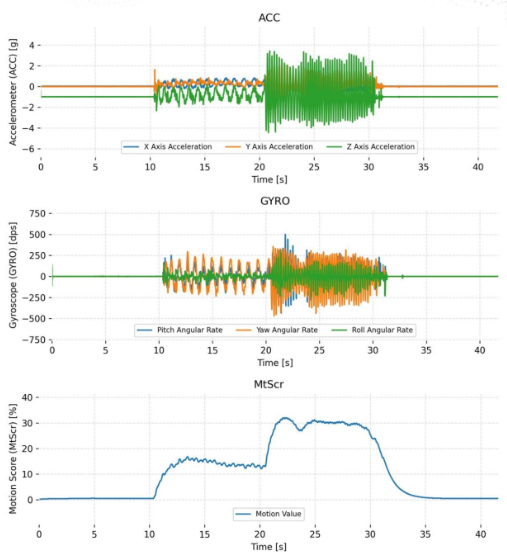
Example of the Motion Score, showing the motion intensity levels of the Accelerometer & Gyroscope
Motion Score
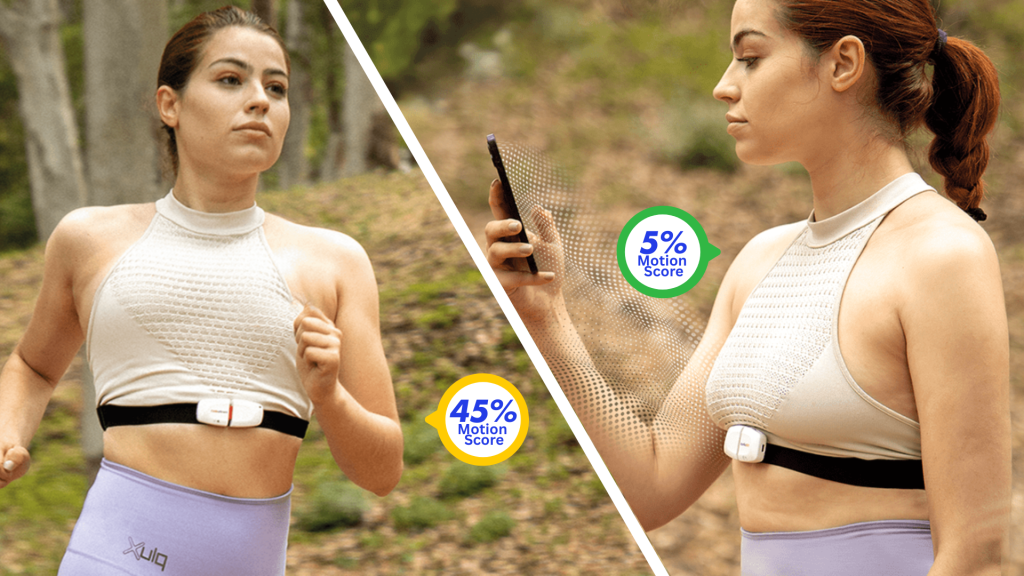
Motion Score is a computed metric available on all Biosignals PRO Smart Sensors.
It combines data from the sensor’s accelerometer and gyroscope to quantify motion intensity during a recording.
The resulting value is expressed as a percentage between 0% and 100% and provides an intuitive representation of the amount of movement. A higher Motion Score indicates more intense movement. For example:
- 0–10%: Rest or small involuntary movements (talking, coughing).
- 10–20%: Walking, spinning, or sleep-related movements.
- 20–40%: Fast-paced walking or jumping.
- 40–60%: Jogging or running.
- 60–80%: Fast running.
- 80–100%: Explosive movements with rapid deceleration (e.g., tennis strokes, punching).

This makes Motion Score useful for:
- Detecting movement artifacts that may affect other sensor readings (e.g., EMG, ECG).
- Assessing motion levels in a simplified way without needing to process raw IMU data.
- Comparing activity between different sensors placed across the body (e.g., arm vs chest).
Find our more details about the motion score here:
Expected Result
Expected result
After completing these steps, you should be able to:
- Record motion and orientation data from the IMU sensor
- Stream Accelerometer, Gyroscope, and Magnetometer signals
- Use the Motion Score metric to estimate movement intensity
- Configure the sensor for different motion analysis applications
Typical applications include:
- Human movement analysis
- Sports science
- Ergonomics
- Activity monitoring
- Research and prototyping
Note: Even when stationary, accelerometer signals may show offsets caused by Earth’s gravity. This behavior is expected and can be used to estimate sensor orientation.
Important: This product is intended for life science education and research only. It is not a medical device and is not intended for diagnosis or treatment.
