

The ECG smart sensor is a research-grade sensor designed to acquire ECG (cardiac activity) signals through surface electrodes.
It features a low-noise differential amplifier with integrated hardware filtering, ensuring stable, high-fidelity recordings even in challenging experimental environments.
This article explains how to set up and use the Electrocardiography (ECG) smart sensor with Biosignals PRO devices.
Compatible Systems
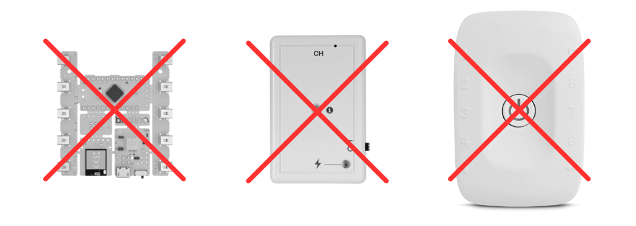
This sensor is exclusively compatible with Biosignals PRO systems.

This sensor is not compatible with any biosignalsplux or BITalino devices.
Recommended Setup
To complete this setup, you will need:
- 1x Biosignals PRO device
- 1x Electrocardiography (ECG) smart sensor
- Disposable ECG electrodes
- Biosignals Studio (Desktop)
Connecting the Sensor to Your Biosignals PRO
Connect the sensor to any of the available Biosignals PRO ports.
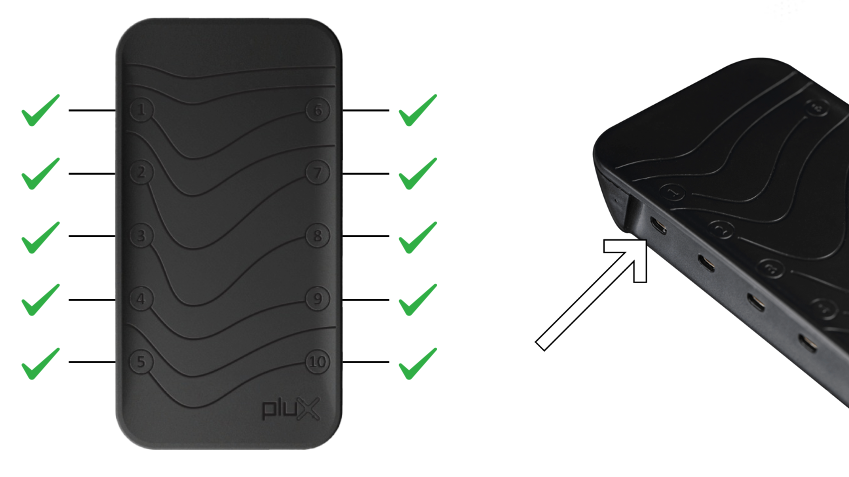
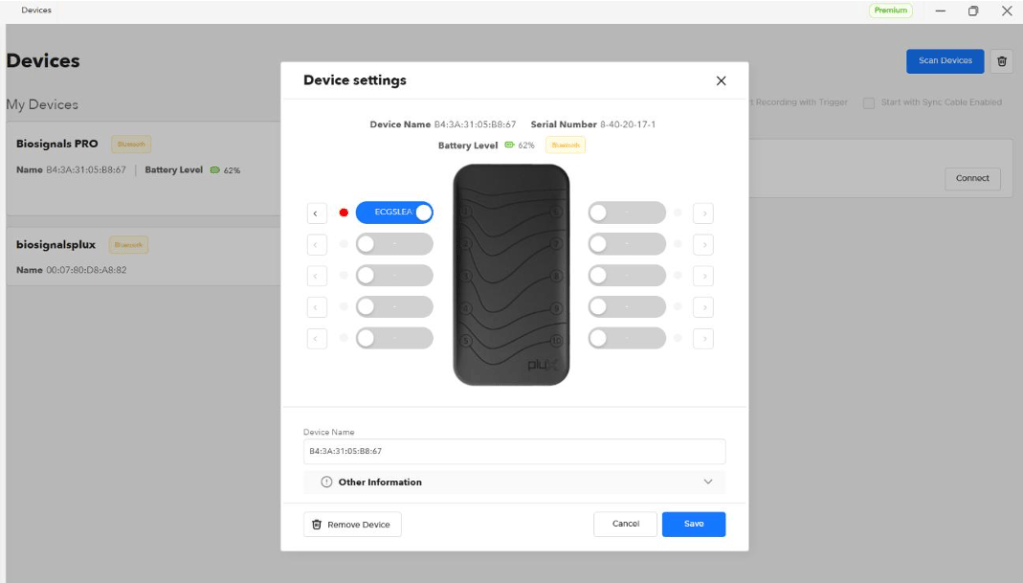
Once connected, the system will recognize the sensor, configure everything automatically, and activate it.
You can also see the sensor in the Biosignals Studio device settings, where it is listed as an ECG sensor on the connected port.
Placing Your Electrodes
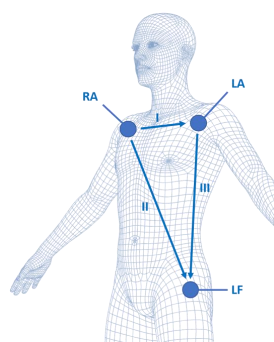
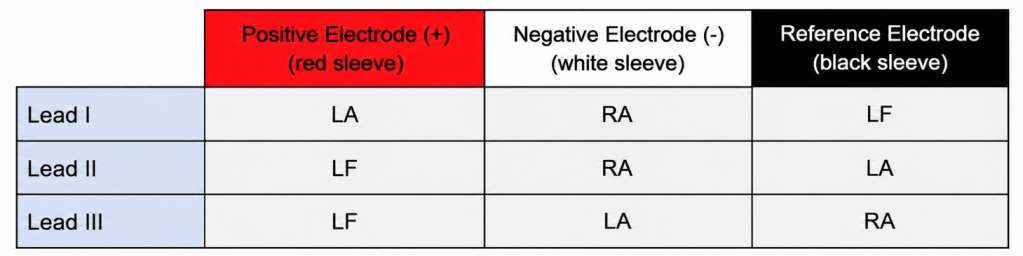
ECG signals are measured using three electrodes: two active electrodes and one reference electrode
For high-quality ECG recordings, we recommend:
- Prepare the skin: Follow the Skin Preparation Tutorial
- Use clean electrodes: Use new disposable electrodes or properly clean reusable electrodes before use
- Connect the electrode snaps from the sensor to the electrodes.
- Place the electrodes on low-motion areas whenever possible to improve signal quality.
- Place the reference electrode on a stable bony area or an electrically neutral location.
The example below shows show the recommended electrode placement for
the acquisition of ECG signals
The reference electrode helps reduce:
– Baseline drift
– Motion artifacts
– Common-mode noise
Start the signal preview in Biosignals Studio.
Verify that:
– The ECG waveform is clearly visible
– Cardiac cycles are distinguishable
– The baseline remains stable
– Motion-related artifacts are minimal
Start the recording once the signal quality is acceptable.
Sensor Signals Interpretation & Samples
The graph below shows a typical example of a raw ECG signal recorded while the individual was seated in a resting position. In this condition, the signal is expected to present a stable baseline and clearly distinguishable cardiac cycles, including characteristic waveform components.

The signal can be used to analyze:
– Heart rate
– Heart rate variability (HRV)
– Cardiac rhythm patterns
Under low-motion conditions, the ECG waveform should appear stable and well-defined.
Higher movement levels may introduce:
– Baseline wander
– Noise bursts
– Signal distortions
Motion Score
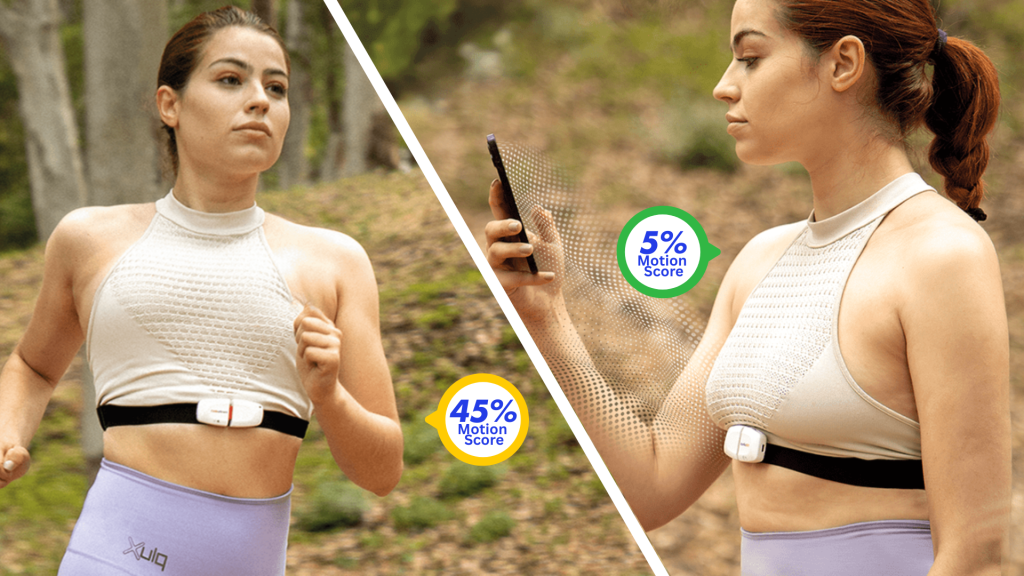
Motion Score is a computed metric available on all Biosignals PRO Smart Sensors.
It combines data from the sensor’s accelerometer and gyroscope to quantify motion intensity during a recording.
The resulting value is expressed as a percentage between 0% and 100% and provides an intuitive representation of the amount of movement. A higher Motion Score indicates more intense movement. For example:
- 0–10%: Rest or small involuntary movements (talking, coughing).
- 10–20%: Walking, spinning, or sleep-related movements.
- 20–40%: Fast-paced walking or jumping.
- 40–60%: Jogging or running.
- 60–80%: Fast running.
- 80–100%: Explosive movements with rapid deceleration (e.g., tennis strokes, punching).

This makes Motion Score useful for:
- Detecting movement artifacts that may affect other sensor readings (e.g., EMG, ECG).
- Assessing motion levels in a simplified way without needing to process raw IMU data.
- Comparing activity between different sensors placed across the body (e.g., arm vs chest).
Find our more details about the motion score here:
Expected Result
You should see a stable ECG waveform with clearly identifiable cardiac cycles.
The recording should respond consistently to cardiac activity while minimizing motion artifacts and baseline instability.
Motion Score values should increase during higher movement intensity periods.
