cardioBAN BLE is your go-to wireless wearable for hassle-free ECG and motion data collection.
In this article, you’ll find a collection of signals recorded with cardioBAN BLE in a Lead I configuration. All normal signals were recorded from healthy adult subjects, while additional benchmarking tests were made with simulated arrhythmia signals from a Fluke Biomedical ProSim 8 Vital Signs and ECG Patient Simulator.
Download the recordings of all the samples plotted on this page here.
Normal ECG
Normal ECG recording while at rest.

Jogging ECG
The following signal was acquired under physical exercise (jogging). The cardioBAN was placed on top of the bottom of the ribcage, below the right chest muscle to minimize muscle movement impacts.

cardioBAN ECG vs. biosignalsplux ECG
The following signals were recorded from a cardioBAN wearable (blue) and an 8-channel biosignalsplux hub with an ECG sensor (green). The objective is to visualize the signals expected performance of the cardioBAN compared to traditional ECG setups.
The biosignalsplux ECG sensor was placed at the traditional electrode positionings with the + and – electrodes placed on the wrist of the subjects in Lead I configuration. cardioBAN was placed in Lead I configuration above the heart on the chest muscle.
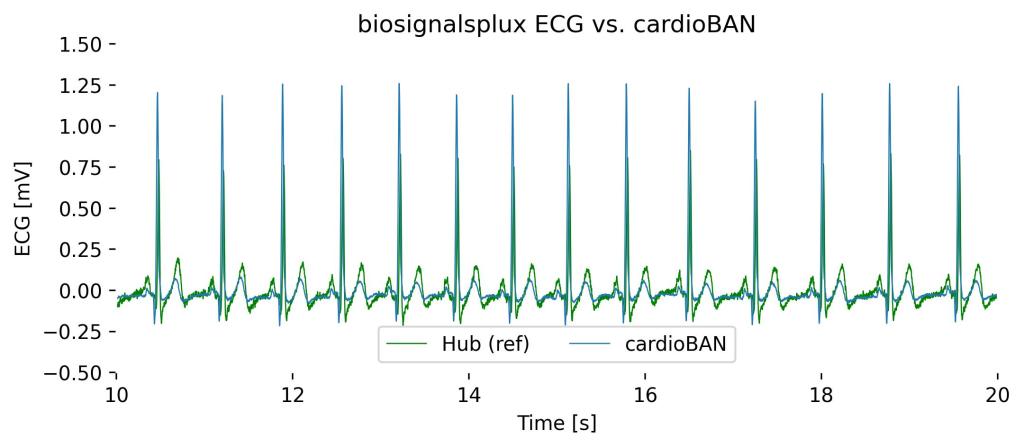
Both signals visualize the ECG signal with the expected characteristics, with the main expected differences being:
- Signal Amplitudes: The cardioBAN, being directly placed over the ribcage thus in closer proximity to the heart, shows higher signal amplitudes as compared to the biosignalsplux ECG placed on the wrists (difference of up about 0.4mV)
- R-Peak Delays: biosignalsplux ECG R-peaks being more distanced from the heart, show minor delays (<0.25s) compared to cardioBAN R-Peaks. The delay occurs due to the time needed for the ECG signal to run through the body until the measurement locations
Arrhythmias & Others
cardioBAN’s was tested against a Fluke Biomedical ProSim 8 Vital Signs and ECG Patient Simulator.
It’s important to highlight that not all arrhythmias are typically measured in Lead I configuration and may require other leads that are not achievable with the cardioBAN. It is possible to capture other ECG signal alterations that are not listed here.
In addition to the observations stated on the following pages, minor differences may occur due to the cardioBAN’s local electrode placement compared to traditional ECG Lead I measures. All other information that is relevant to ECG Lead I configurations is provided.
DISCLAIMER
cardioBAN is designed for life sciences and clinical research purposes and is not suitable for medical diagnosis or treatment.
ECG signal distortions can occur from non-physiological factors (e.g., movement artifacts, old electrodes) and may not be of pathophysiological original.
Should you experience any ECG alterations with your cardioBAN and cardiac discomfort during a recording, stop the recording and seek a healthcare professional for clinical evaluation.
Asystole
Asystole is a type of cardiac arrhythmia characterized by a complete absence of electrical activity in the heart, which appears as a flat line on an electrocardiogram (ECG).
This condition, often referred to as “flatline,” signifies a cessation of cardiac output and requires immediate emergency intervention, such as cardiopulmonary resuscitation (CPR) and advanced life support.

Observations in Lead I cardioBAN Signal: Complete absence of heart contractions with baseline characteristics of an ECG flatline.
Atrial Fibrillation (Afib)
Atrial fibrillation is characterized by rapid and disorganized electrical activity in the atria, leading to an irregularly irregular rhythm visible on an ECG, particularly evident in Lead I.
On the ECG, you will notice a lack of distinct P waves and a variable R-R interval, indicating the atria’s erratic quivering instead of a coordinated contraction.
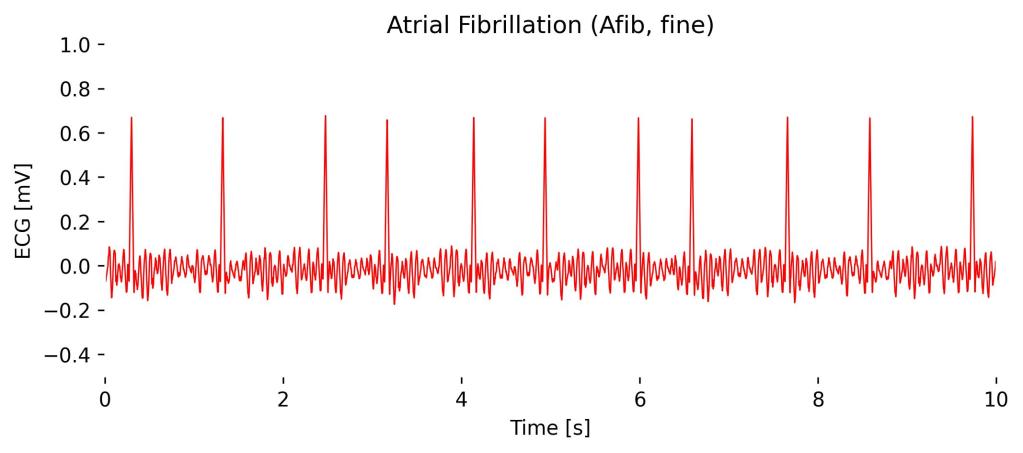
Observations in Lead I cardioBAN Signal: Overall, the ECG baseline is irregular, along with clear yet irregularly spaced R-peaks.
Atrial Flutter
Atrial flutter is an arrhythmia characterized by a rapid, regular pattern of atrial contractions, typically shown as a “sawtooth” pattern of flutter waves at a rate of about 250-350 beats per minute in Lead II, which is more diagnostic than Lead I.
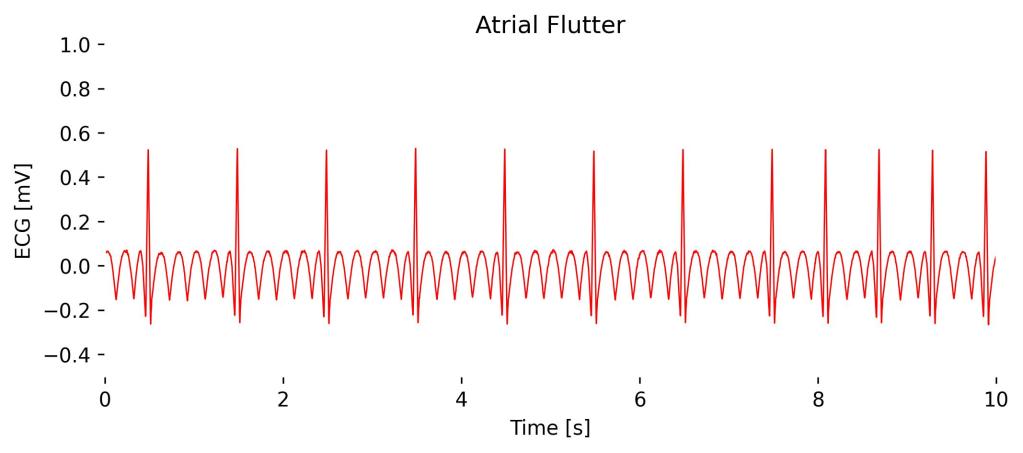
Observations in Lead I cardioBAN Signal: Abnormal heart rhythm with significantly distorted baseline in “sawtooth” pattern. Heart rate decreases during expiration (see 2s to 7s) and increases during inspiration (see 7s to 10s).
Atrial Tachycardia
Atrial tachycardia is a type of supraventricular tachycardia where the heart’s atria contract at an abnormally high rate of 150-250 beats per minute, typically originating from a focus above the ventricles.
In Lead I, you can see distinct P waves occurring at a rapid pace followed by a normal QRS complex, indicating the rapid atrial activation separate from the normal sinus node activity.
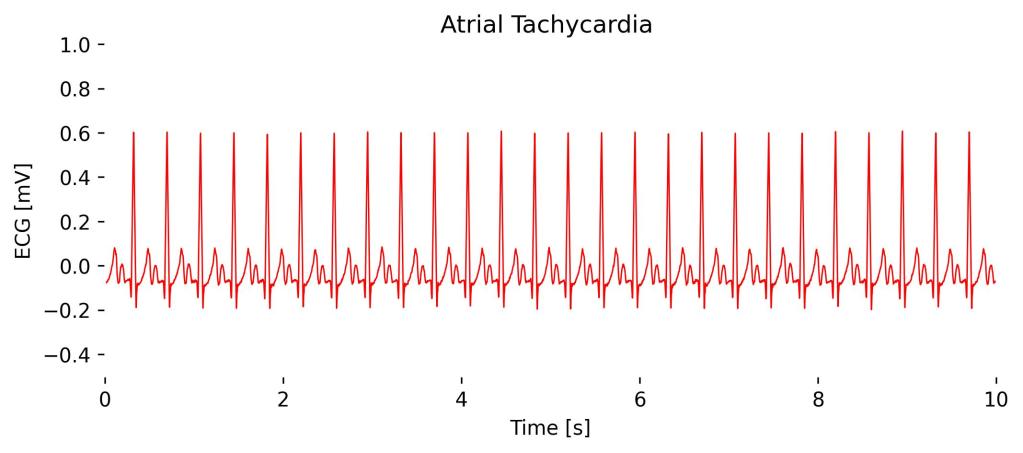
Observations in Lead I cardioBAN Signal: Abnormally high heart rhythm (here at 160 bpm) without QRS complex distortions.
AV Block (2nd Degree, Mobitz Type I)
It is characterized by progressive prolongation of the PR interval on consecutive beats until a beat is blocked (a P wave not followed by a QRS complex).
In Lead I, you would still notice this pattern of gradually lengthening PR intervals followed by a dropped QRS complex, which reflects the increasing difficulty the electrical impulse faces in passing from the atria to the ventricles until it fails entirely for one cycle.
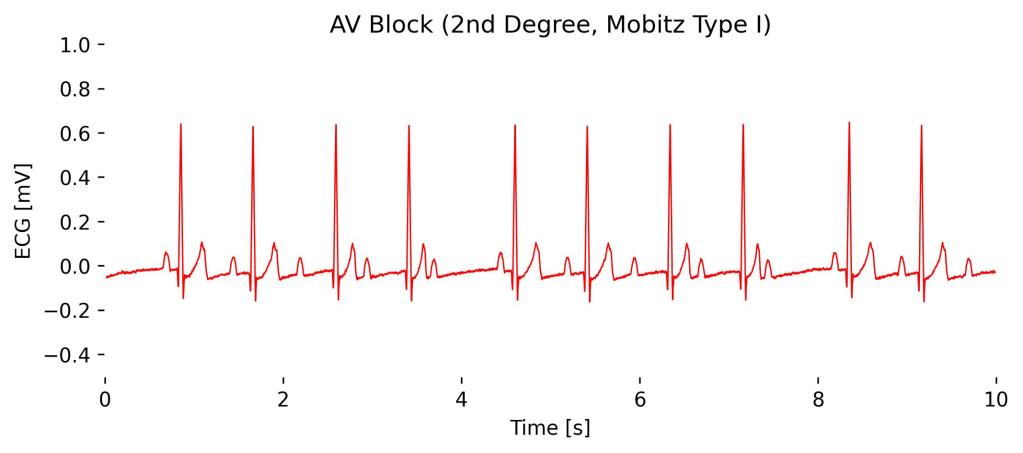
Observatios in Lead I cardioBAN Signal: Progressive prolongation of the PR-interval in the first 4 beats until, eventually, an atrial impulse is completely blocked (here at 4s). This pattern is repeated in the following 4 betas until another impulse is completely blocked at 8s.
AV Block (2nd Degree, Mobitz Type II)
Characterized by the sudden and unexpected failure of some atrial electrical impulses to conduct to the ventricles without the progressive PR interval prolongation seen in Mobitz Type I.
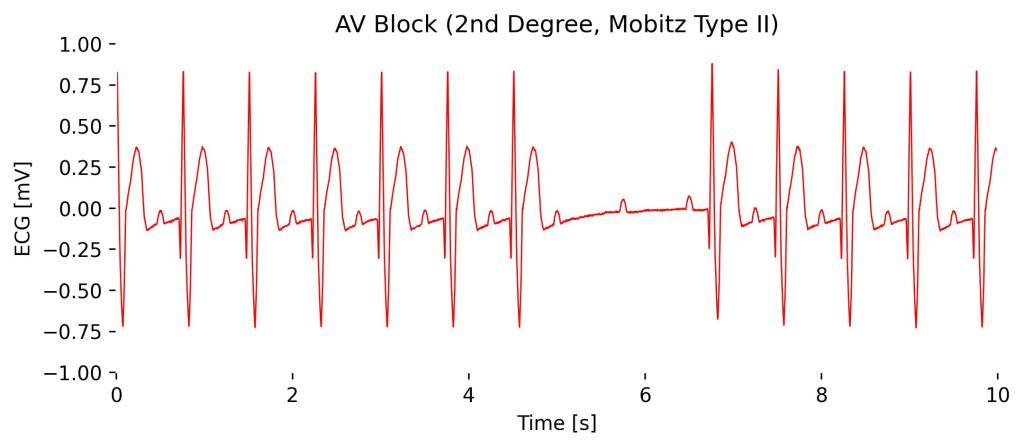
Observations in Lead I cardioBAN Signal: Consistent PR-intervals in beats from 0s to 5s until a complete absence of a full contraction at 6s occurs, with only the P-wave visible without a subsequent QRS complex. Additional distortions in ST-segments can be observed in Lead I configuration.
AV Block (3rd Degree, Complete)
Third-degree AV block, or complete heart block, is characterized by the complete dissociation of atrial and ventricular activities; the atria and ventricles beat independently of each other.
On an ECG you will observe regular P-waves at a normal atrial rate, and completely unrelated, slower, regular QRS complexes often originating from an escape rhythm in the ventricles, illustrating no coordination between P waves and QRS complexes.
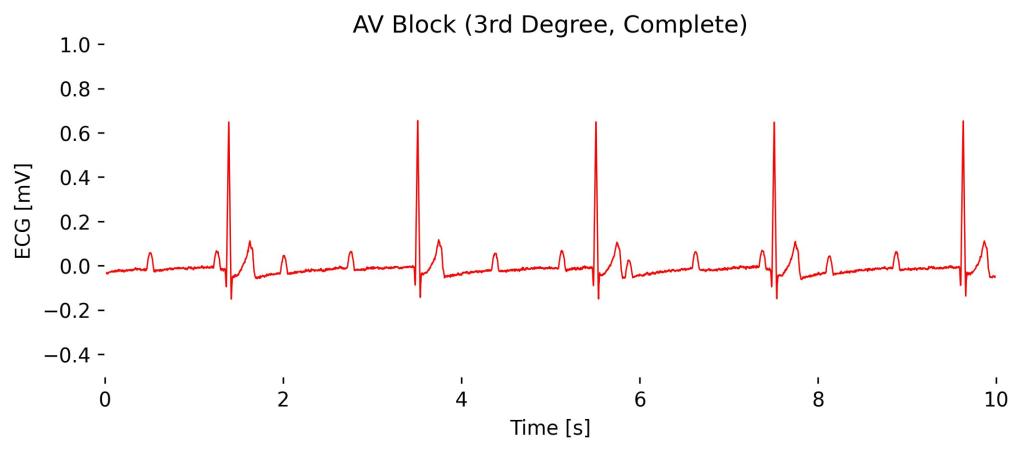
Observations in Lead I cardioBAN Signal: Periodic full absences of heart contractions with only the P-wave remaining in a semi-regular interval without subsequent QRS complexes.
Bradycardia
Bradycardia is a heart rate slower than normal, typically less than 60 beats per minute in adults, and can be seen on an ECG across all leads, including Lead I.
On the ECG, you would observe a slower rhythm with regular intervals between beats but otherwise normal P waves, PR interval, and QRS complexes, indicating that the heart’s electrical activity is normal except for the reduced rate.
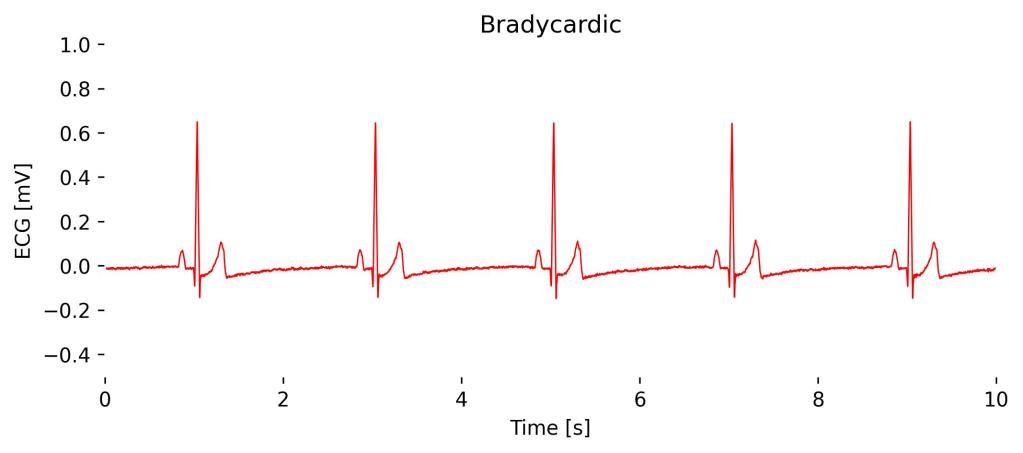
Observations in Lead I cardioBAN Signal: Abnormally low heart rate (here at 40 bpm) with long intervals between heartbeats and no additional signal distortions.
Tachycardia
Tachycardia refers to a heart rate that exceeds the normal resting rate, generally defined as over 100 beats per minute in adults, observable on an ECG across all leads including Lead I.
The ECG will show a faster-than-normal rhythm with a reduced interval between heartbeats; however, depending on the type of tachycardia, the waveform features such as P waves, PR interval, and QRS complexes may vary, indicating different origins and mechanisms of the rapid rate.
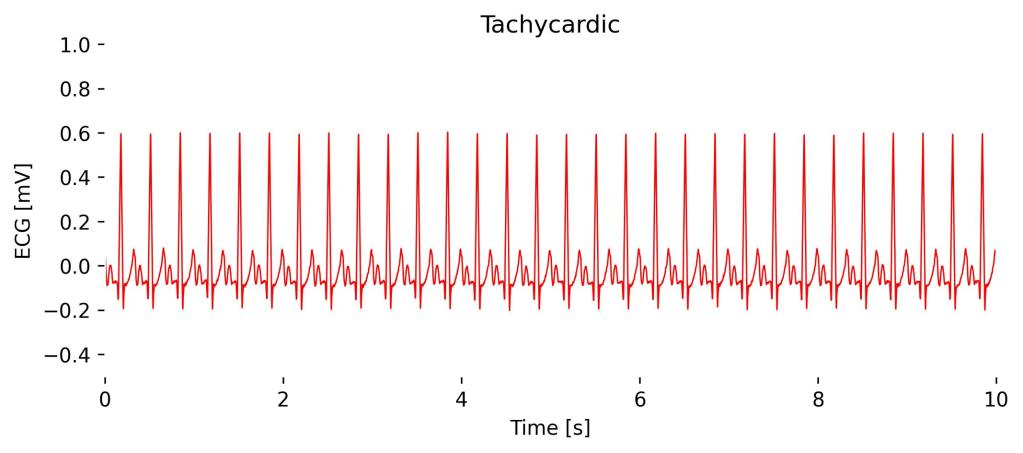
Observations in Lead I cardioBAN Signal: Abnormally high heart rate (here at 180 bpm) with short intervals between heartbeats.
Hypertension & Hypotension
Note: Hypertension and hypotension are not arrhythmias, yet their results can impact the ECG waveform or heart rate, which is why they’re included here.
Chronic hypertension can lead to changes observable on an ECG, such as left ventricular hypertrophy.
In an ECG, this might manifest as higher amplitude R waves in leads I, aVL, V5, and V6, and deeper S waves in V1 and V2, reflecting the increased muscle mass of the left ventricle working harder against elevated blood pressure. This may be accompanied by increased heart rate.
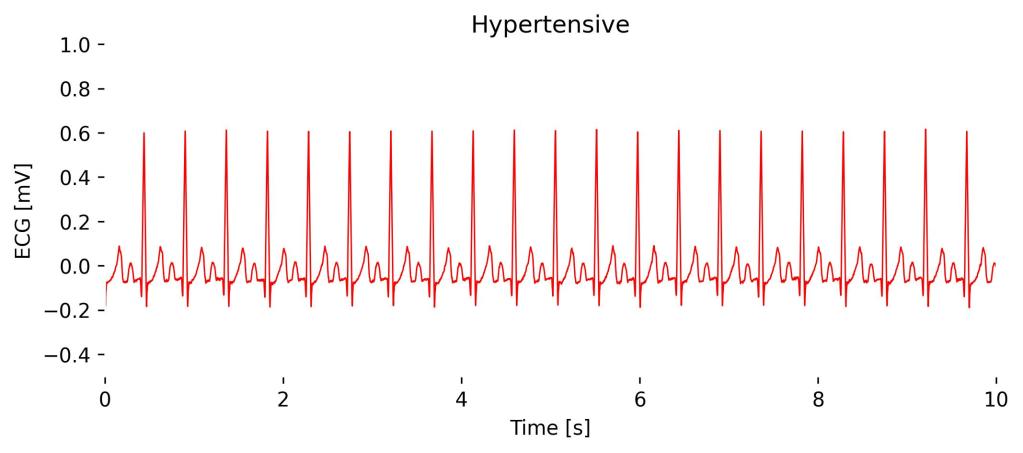
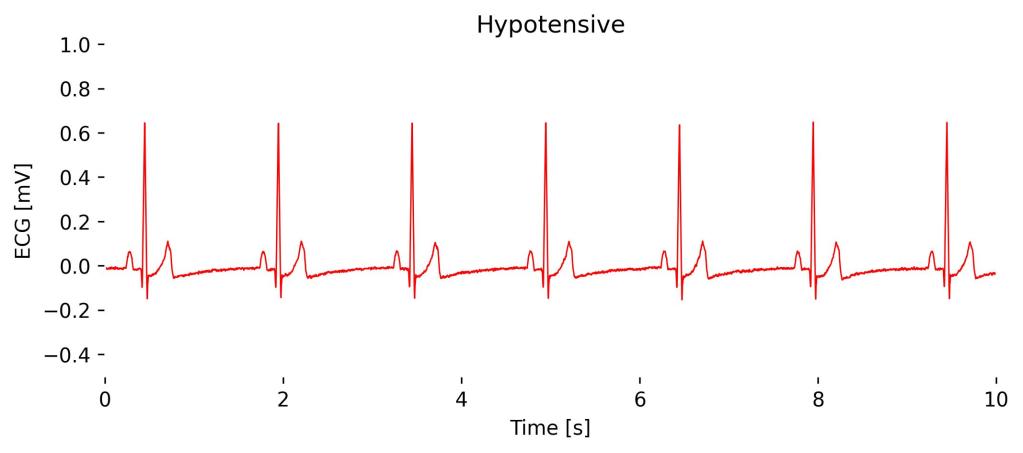
Observations in Lead I cardioBAN Signal: The effects of Hypertension, primarily the increased R-peak amplitudes, are not clearly visible in cardioBAN Lead I recordings. This is due to the comparatively short electrode distance and placement close to the heart compared to traditional Lead I placements.
The impact of Hypertension and Hypotension may only be noticeable in changes in heart rate.
Left Bundle Branch Block (LBBB)
Left Bundle Branch Block (LBBB) is a cardiac conduction abnormality where the electrical impulse is delayed in the left bundle branch, causing the left ventricle to contract later than the right.
On an ECG, particularly noticeable in Lead I, you’ll see a broadened QRS complex exceeding 120 ms with an absent Q and distorted, deep S-wave, reflecting the altered sequence of ventricular activation.

Observations in Lead I cardioBAN Signal: Periodic distortion of the QRS complex, with an absent Q wave and distorted, deep S wave.
Right Bundle Branch Block (RBBB)
Right Bundle Branch Block (RBBB) is a cardiac conduction abnormality where the electrical impulse is delayed or blocked in the right bundle branch, causing the right ventricle to contract later than the left.
On an ECG, RBBB is identified by a widened QRS complex greater than 120 ms and a broad slurred S-wave. These changes are due to the delay in right ventricular depolarization.

Observations in Lead I cardioBAN Signal: Periodic occurrences of deep distorted S-waves.
Missed Beat
A missed heartbeat, often referred to as a “skipped beat,” is typically the result of a premature contraction or a brief pause following a premature contraction, and is not an arrhythmia but rather a common variation in normal heart rhythm.
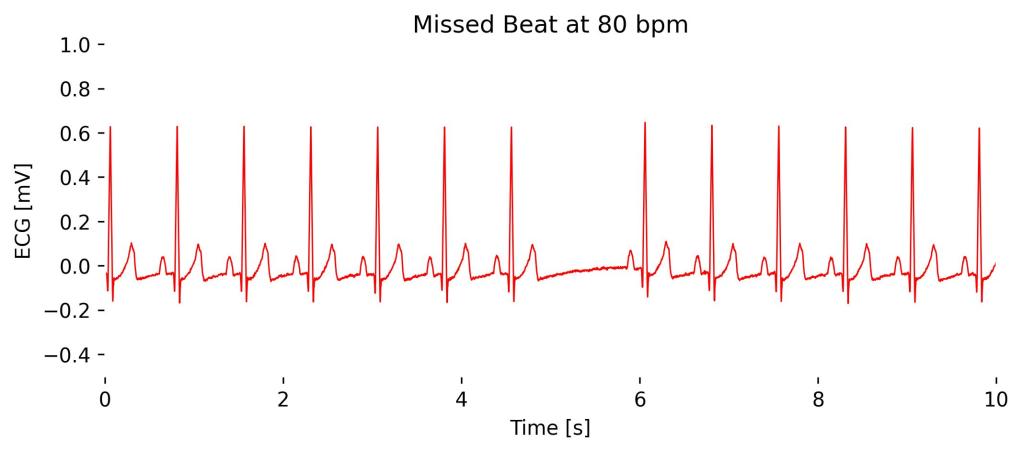
Observations in Lead I cardioBAN Signal: Normal ECG segments with missing, skipped heartbeat at 5s.
Monomorphic Ventricular Tachycardia (Mono Vtach, Stable)
Monomorphic Ventricular Tachycardia (VT), stable type, is a potentially life-threatening rhythm where the ventricles contract at a rapid rate, generally between 100 to 250 beats per minute, with the electrical activity originating from a single focus within the ventricles.
On an ECG, monomorphic VT typically shows a series of wide QRS complexes that are similar in shape, indicating that each beat originates from the same ventricular focus; in Lead I, these QRS complexes would be wide and consistent in morphology but without the typical preceding P wave of normal sinus rhythm, reflecting the ventricular origin of the beats.

Observations in Lead I cardioBAN Signal: Distorted sinusoidal waveform.
Poly-Ventricular Tachycardia (Poly Vtach)
Poly-ventricular tachycardia is a variation in the shape of the QRS complexes on the ECG. This variation reflects the multiple foci in the ventricles that are generating the electrical impulses.
It is characterized by a fast heart rate with a series of wide QRS complexes that change in amplitude, axis, and duration, creating a pattern that may appear to twist around the isoelectric baseline. In Lead I, as with other leads, you would see this pattern of varying QRS complexes without discernible P waves, indicating chaotic ventricular activity.
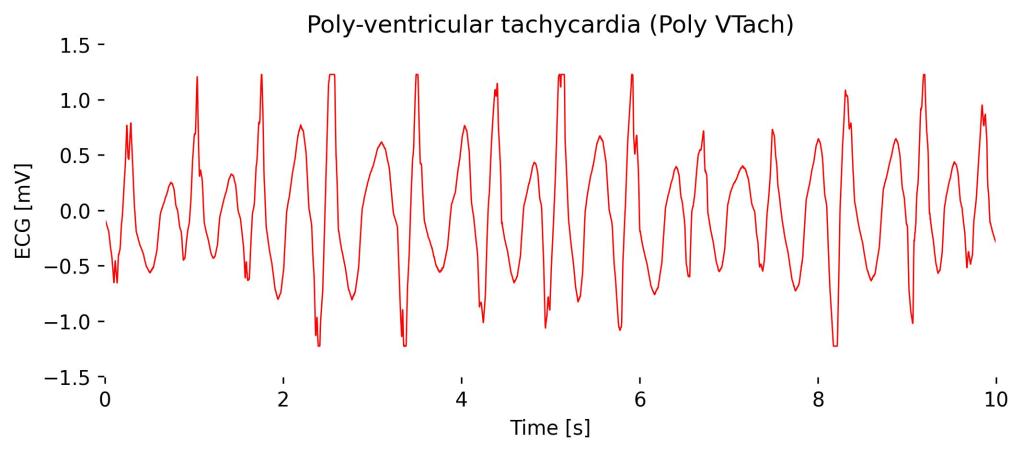
Observations in Lead I cardioBAN Signal: Roughly distinguishable R-Peaks with repeated highly distorted and chaotic QRS complexes.
Sinus Arrhythmia
Sinus arrhythmia is typically a benign condition characterized by a slight heart rate irregularity that varies with breathing—increasing during inspiration and decreasing during expiration.

Observations in Lead I cardioBAN: Variations in heart rate during different segments of respiration. Here, increased heart rate (R-peaks are closer to each other) during 2s to 6s of inspiration and greater intervals afterward during expiration.
Depending on the placement of the ECG on the thorax, additional changes in R-peak amplitude may occur, such as amplitude increase during expiration (ECG sensor closer to the heart) and amplitude ecrease during inspiration (ECG sensor is more distanced from the heart due to chest expansion).
Sinus Bradycardia
Sinus bradycardia is a heart rhythm originating from the sinoatrial node with a rate less than 60 beats per minute, considered normal in many well-conditioned athletes and during sleep.
On an ECG, sinus bradycardia appears as a regular rhythm with normal P waves, PR interval, and QRS complexes, with the primary distinction being the slower rate; in Lead I, you would observe these normal waves occurring at a decreased frequency, reflecting the heart’s reduced pace but maintaining the typical characteristics of sinus rhythm.
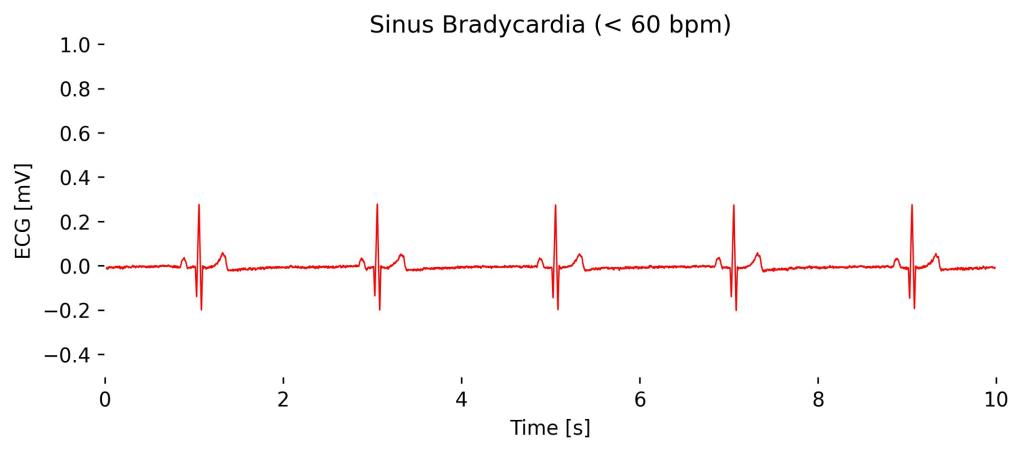
Observations in Lead I cardioBAN Signal: Normal QRS complexes at reduced frequency with no signs of pathological distortions.
Supraventricular Tachycardia (SVT)
Supraventricular Tachycardia (SVT) is a rapid heart rhythm originating from above the ventricles, typically involving the atria or the AV node.
On an ECG, SVT presents as a very fast heart rate, usually between 150 and 250 beats per minute, with narrow QRS complexes due to the impulse originating above the ventricles.
In Lead I, the P waves may be absent, hidden within the QRS complexes, or appear just after the QRS complexes depending on the specific type of SVT, making it sometimes challenging to discern the atrial activity. The rapid and regular appearance of the QRS complexes is the hallmark on the ECG, indicating the rapid firing from the supraventricular region.
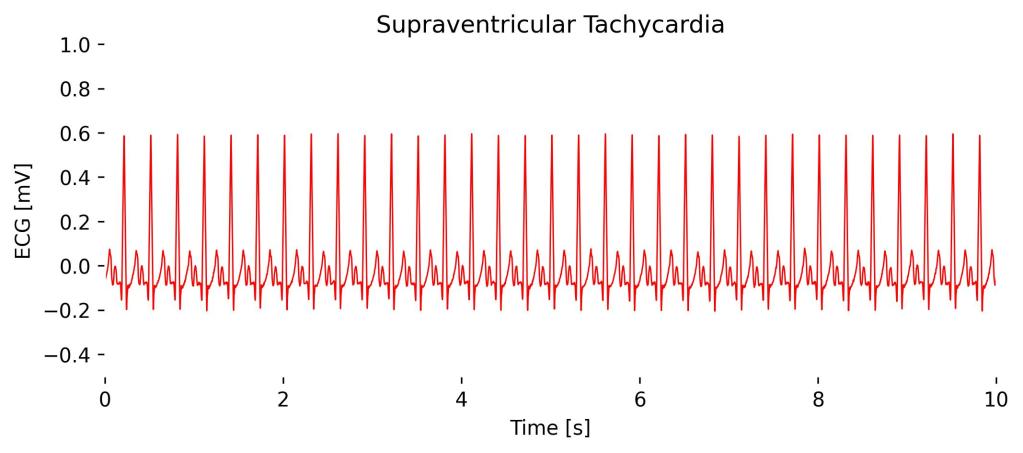
Observations in Lead I cardioBAN Signal: Rapid and regular QRS complexes. Although appearing in an abnormally high heart rate, no distortions of the QRS complexes are visible.
Ventricular Fibrillation (Coarse)
Coarse Ventricular Fibrillation (VFib) is an advanced and life-threatening cardiac arrhythmia characterized by irregular and erratic electrical activity in the ventricles, resulting in an ineffective, quivering movement rather than a coordinated contraction.
On an ECG, coarse VFib is identified by irregular, large-amplitude waveforms that vary in size and shape, appearing chaotic without any discernible P waves, QRS complexes, or T waves. Other than in Atrial Fibrillation (Afib), which contains a chaotic, noisy baseline while still having identifiable R-peaks.
In Lead I, as in other leads, this arrhythmia manifests as a turbulent and unpredictable pattern, indicating a severe disruption in ventricular electrical activity, which requires immediate medical intervention, typically defibrillation.
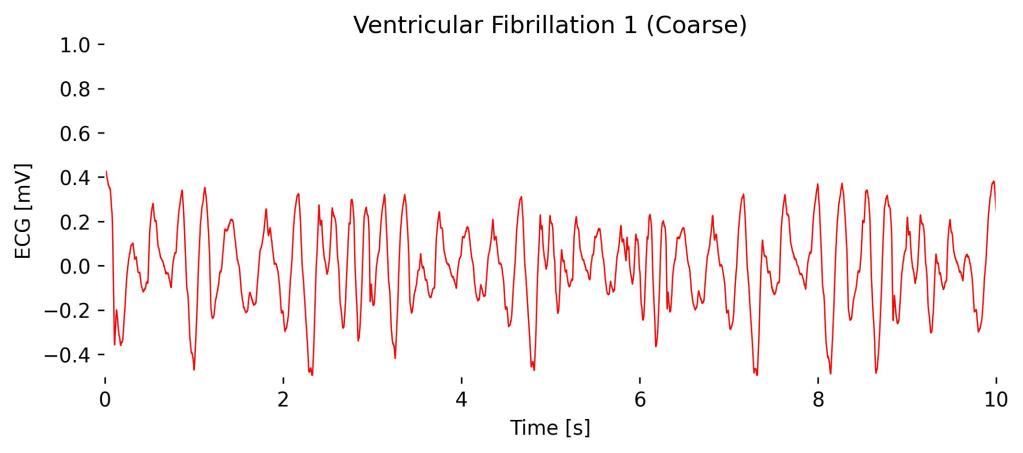
Observations in Lead I cardioBAN Signal: Chaotic baseline and not definable QRS complexes.
Motion Sensors
respiBAN comes with built-in triaxial Acceleromter and Gyroscope to record motion data along with your respiration data.
Accelerometer
The Accelerometer measures acceleration along the three axes (x, y, z). The amplitude of the signal correlates with the acceleration that occurs along each axis.
In the following signal, this ampltiude change is visualized in the following intervals:
- 0s to 10s: No acceleration / movement
- 10s to 20s: Moderate acceleration / movement
- 20s to 30s: Intensive acceleration / movement
- 30s to 40s: No acceleration / movement

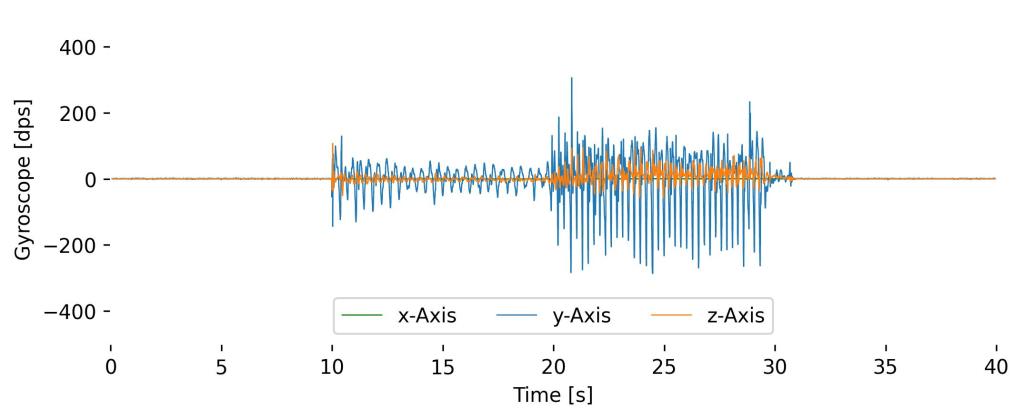
Gyroscope
The Gyroscope measures angular velocity, which is the rate at which an the respiBAN rotates around the axes (x, y, z). The amplitude of the signal correlates with the acceleration that occurs around each axis.
The following signals show the results of the Gyroscope when conducting the same motion pattern of the previous Accelerometer sample signal.